
Introduction to the Dolly Indicator The Dolly indicator is a pretty complex forex indicator providing entry points and profit targets. On the left side of the chart, you will see trade analysis including Buy Area and Sell Area details, plus today’s support and resistance levels. The profit targets of the Dolly forex indicator are pretty…
Category: Forex MT4 Indicators
Alternative Ichimoku Indiactor
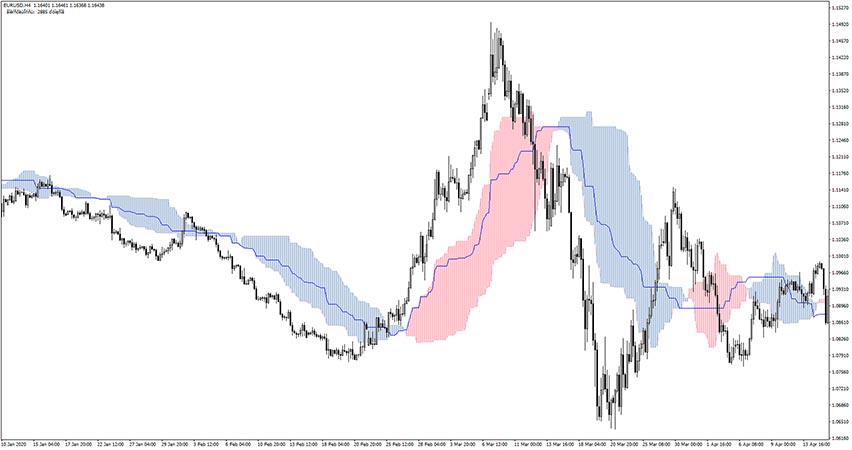
Introduction to the Alternative Ichimoku Indicator The Alternative Ichimoku indicator is a variation of the standard Ichimoku Kinko Kyo indicator. The same trading rules as with standard Ichimoku apply here too. It fits all kinds of timeframes and currency pairs. The indicator is displayed directly on the main trading chart. The default settings can be…
Unstoppable Forex Profit Indicator

Introduction to the Unstoppable Forex Profit Indicator The Unstoppable Forex Profit indicator provides buy/sell arrows as trading signals. It also draws small yellow squares as short term high/low points. In the top right corner of the chart, the Unstoppable Forex Profit indicator shows useful information like current signal (BUY or SELL label with an arrow…
Forex Scalping Indicator

Introduction to the Forex Scalping Indicator The Forex Scalping Indicator is, as the name suggests, a scalping tool to generate quick profits from the forex market. As trading signals, the Forex Scalping indicator displays blue and red vertical rectangles. The occurrence of a blue rectangle indicates a sell signal. Similarly, the occurrence of a red…
Forex Gunduro Angle Indicator

Introduction to the Forex Gunduro Angle Indicator The Forex Gunduro Angle indicator shows exactly where and when you to enter a trade in the forex market. It is a versatile forex indicator as it can be used for scalping, day trading, or even swing trading. The Gunduro Angle forex indicator displays green/red lines with yellow…
Forex Trend V1 Indicator
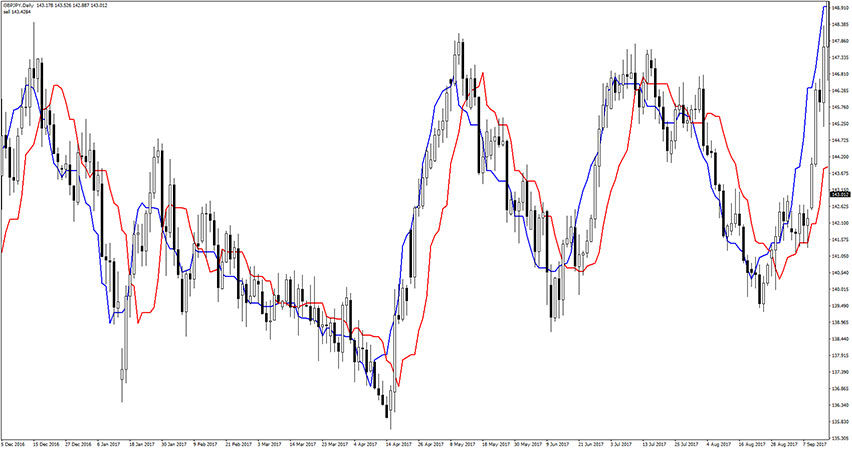
Introduction to the Forex Trend V1 Indicator The Forex Trend V1 Indicator is a custom forex trend-following forex indicator. It applies a crossover of two custom lines to generate trading signals. These signals are pretty easy to follow. It works best during strong trends, and unfortunately, it tends to give noisy signals during sideways market…
RSI Indicator: Beginners Guide

What is the RSI indicator? The abbreviation RSI stands for a Relative Strength Index and it a well-known oscillator used in technical analysis. It is applicable in multiple markets, including forex, stocks, and cryptocurrencies. The RSI indicator shows the price momentum by comparing bullish and bearish movements of closing prices of a specific asset. The…
Profitunity Bars Indicator
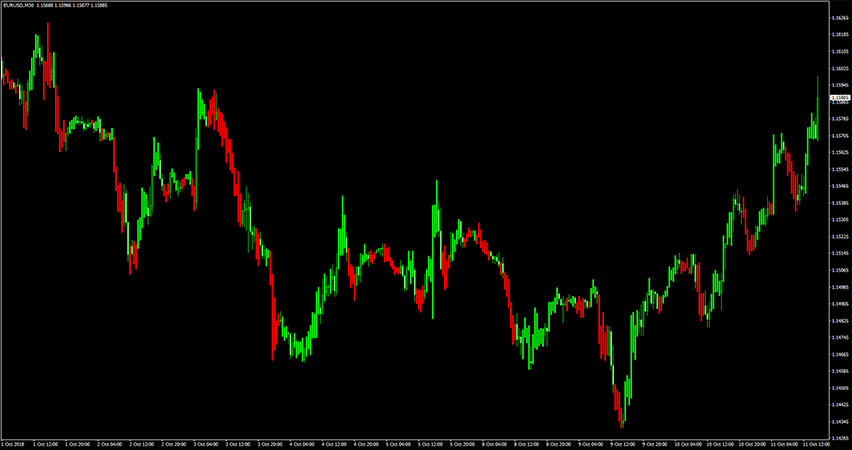
Introduction to the Profitunity Bars Indicator The Profitunity Bars indicator uses a custom formula to calculate trend momentum for each candlestick and colorizes these bars accordingly. When the candlesticks are colored green, it means that the current short time period trend is bullish. Similarly, when the candlesticks are colored red, it means that the current…
Forex Tyrannosaurus Indicator
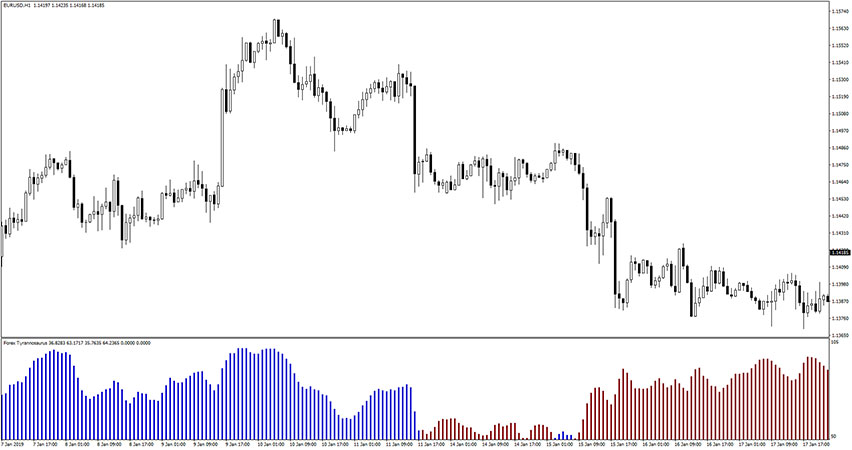
Introduction to the Forex Tyrannosaurus Indicator The Forex Tyrannosaurus indicator uses a custom formula to calculate trend momentum and depicts these values in the form of histogram bars colored into blue and red. It’s pretty straightforward to use the Forex Tyrannosaurus indicator, simply blue bars reflect bullish trend and red bars reflect bearish trend. We…
Candle Difference Indicator
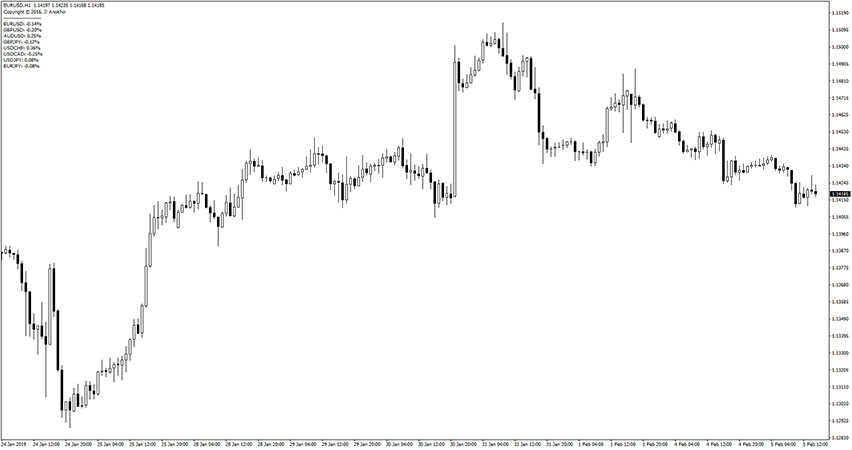
Introduction to the Candle Difference Indicator The Candle Difference indicator displays the change in price as a percentage relative to the open price of the current candle. It can display up to 8 pairs on the chart. It fits all kinds of timeframes and currency pairs. The indicator is displayed directly on the main trading…