
Introduction to the CCI RSI Index Indicator The CCI RSI Index Indicator is, as the name suggests, a combination of Commodity Channel Index (CCI) and Relative Strength Index (RSI) into one forex indicator. Readings of that indicator are pretty intuitive. Green bars indicate a bullish trend-momentum, and similarly, red bars of the CCI RSI Index…
Tag: rsi indicators
RSI with Trend Catcher Signal Indicator

Introduction to the RSI with Trend Catcher Signal Indicator The RSI with Trend Catcher Signal Indicator is based on the Relative Strength Index, but it colorizes the signal line according to the trend direction. When the RSI signal line is green it means that the signal is positive and the trend is considered bullish. Conversely,…
RSI TMA Centered Bands Indicator

Introduction to the RSI TMA Centered Bands Indicator The RSI TMA Centered Bands Indicator combines Relative Strength Index and TMA Bands into one trading tool. A trader should look for buy trade opportunities when the CCI is below the middle line of the TMA. Similarly, sell trade opportunities occur when the RSI is above the…
RSI of Adaptive Moving Average Indicator

Introduction to the RSI of Adaptive Moving Average Indicator The RSI of Adaptive Moving Average Indicator is, as the name suggests, a combination of Relative Strenght Index and Moving Average indicator. Simply speaking, it plots a smoothed line that follows price. The signal line is either green or orange. A green line indicates bullish trend-momentum,…
RSI HMA Min Max Levels MTF Indicator

Introduction to the RSI HMA Min Max Levels MTF Indicator The RSI HMA Min Max Levels MTF Indicator is a unique forex trading tool based on the Relative Strength Index (RSI) and Hull Moving Average (HMA). It displays a signal line that moves within a channel. When the signal goes outside the channel bands and…
RSX RSI Bar Chart Indicator
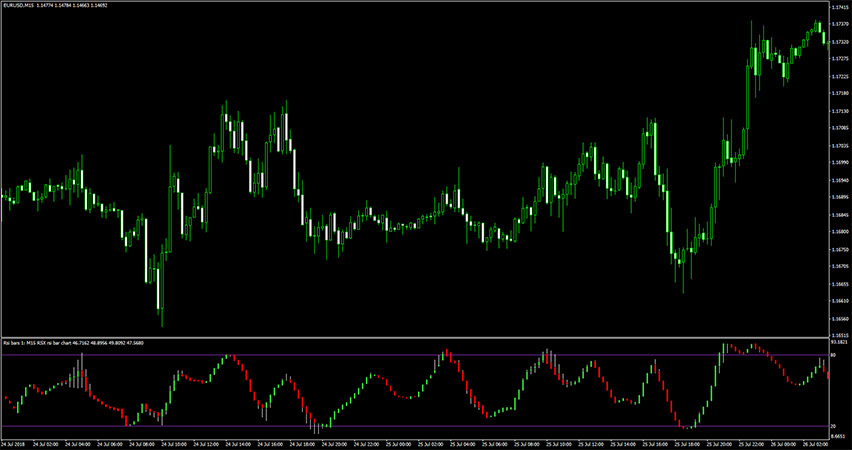
Introduction to the RSX RSI Bar Chart Indicator The RSX RSI Bar Chart Indicator displays custom bars calculated based on the Relative Strenght Index and the RSX indicator. Pay attention to the 20 and 80 levels, which are respectively oversold and overbought zones. When its bars falls below 20 level, the price will make a…
Advanced MTF RSI Indicator

Introduction to the Advanced MTF RSI Indicator The Advanced MTF RSI Indicator provides the oversold/overbought levels of several different time frames by using only one chart. A trader can use it for confirmation of short-term trades by seeing higher time frame RSI levels. In simple words, you will have Relative Strenght Index values of different…
Stochastic RSI Indicator

Introduction to the Stochastic RSI Indicator The Stochastic RSI Indicator (Stoch RSI) was developed to increase the sensitivity and reliability of the regular RSI indicator when it comes to trading off overbought/oversold RSI levels. In other words, it is used in forex technical analysis to provide a stochastic calculation to the RSI indicator. Of course,…
RSI Indicator: Beginners Guide

What is the RSI indicator? The abbreviation RSI stands for a Relative Strength Index and it a well-known oscillator used in technical analysis. It is applicable in multiple markets, including forex, stocks, and cryptocurrencies. The RSI indicator shows the price momentum by comparing bullish and bearish movements of closing prices of a specific asset. The…
RSI FWA Divergence Indicator

Introduction to the RSI FWA Divergence Indicator The RSI FWA Divergence indicator scans and displays divergences between price and the RSI indicator. That gauge is capable of recognizing both bullish and bearish divergences. You can successfully utilize low-risk trend reversal trading in both bullish and bearish markets. It is a pretty versatile tool as it…