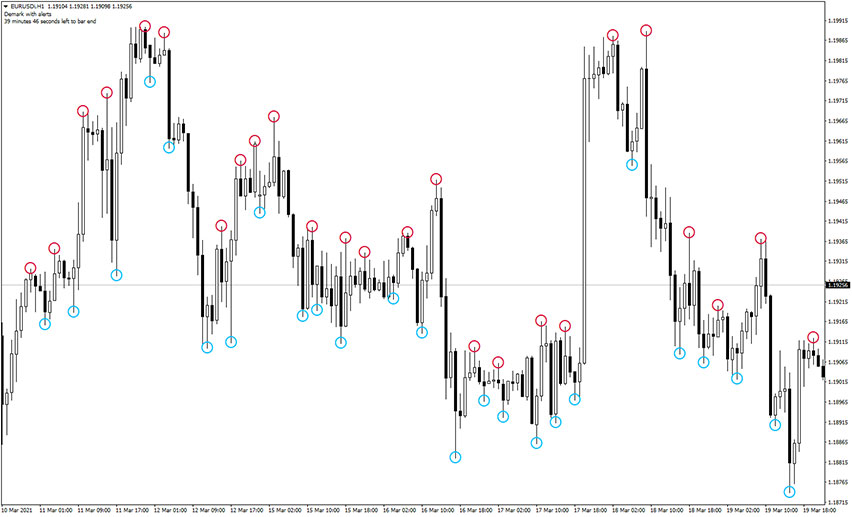
Introduction to the Demark V1.01 Indicator The Demark V1.01 indicator is a technical analysis tool that is used to predict short-term price action based on changes in intra-day highs and lows. It’s a handy gauge to time market entry points and exit points. The indicator is displayed directly on the main trading chart. It fits…
Category: Forex MT4 Indicators
Agimat Reversal Indicator

Introduction to the Agimat Reversal Indicator The Agimat Reversal indicator is based on the zigzag reversal patterns and therefore offers great entry points and exit points. The indicator recognizes the tops and bottoms of the market. It marks these levels with arrows. Once the forex indicator displays a UP arrow, a trader can place a…
Elliott Wave Oscillator Indicator
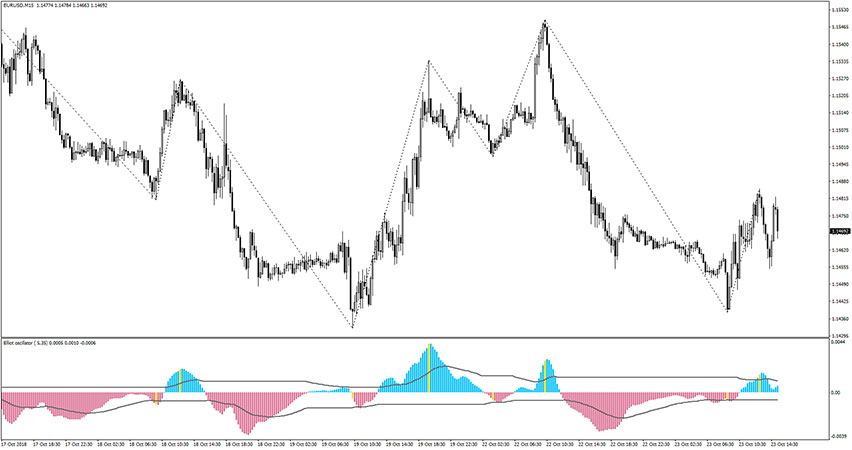
Introduction to the Elliott Wave Oscillator Indicator The Elliott Wave Oscillator indicator technically is the difference between a 5-period and 35-period simple moving average (SMA) based on the close of each candlestick. It’s helpful in determining where an Elliott wave ends and a new one starts. In other words, determining when the market price movement…
Pin Bar Buy Sell Indicator
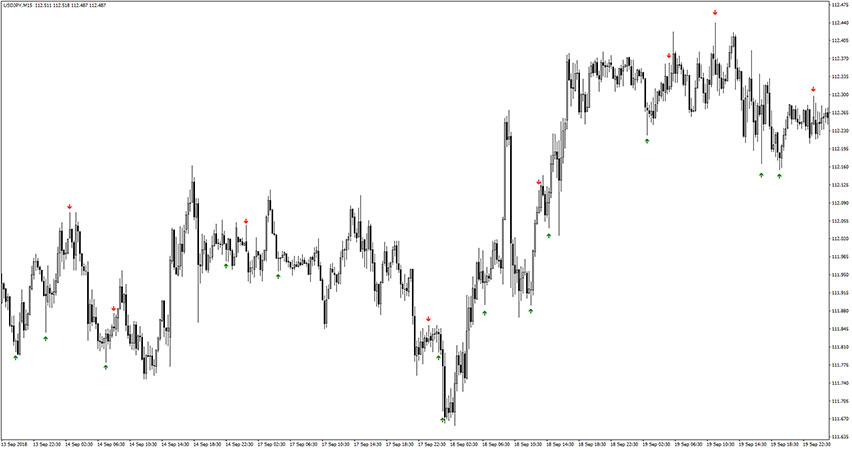
Introduction to the Pin Bar Buy Sell Indicator The Pin Bar Buy Sell indicator recognizes pin bar candlesticks and when the signal is generated it marks the triggering candles with buy/sell arrows. The indicator is displayed directly on the main trading chart. It fits all kinds of timeframes and currency pairs. The default settings can…
Drag & Drop Volume Profile Indicator
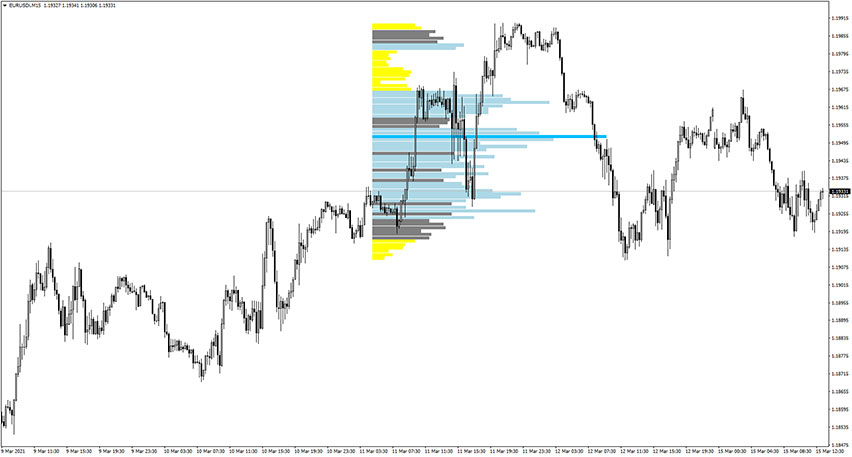
Introduction to the Drag & Drop Volume Profile Indicator The Drag & Drop Volume Profile indicator automatically identifies high-probability market turning points for you and instantly shows you low-risk trade entries and exits. To make the indicator display properly on the charts, you will need to turn to “true” the following settings option: “display volume…
Colored Stochastic Indicator
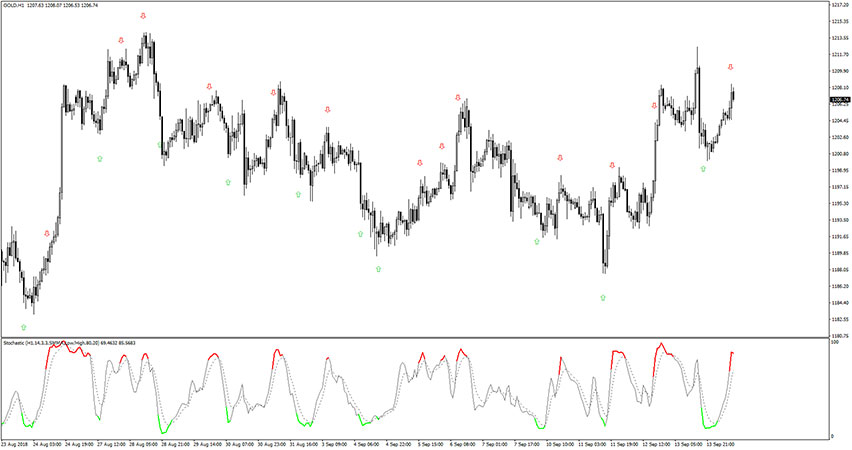
Introduction to the Colored Stochastic Indicator The Colored Stochastic indicator is, as the name suggests, a custom stochastic gauge that colorizes the oscillator when it reaches overbought/oversold levels. You can set alerts when that situation occurs or you can even set arrows to display on the chart. It fits all kinds of timeframes and currency…
Fourier Extrapolator Indicator
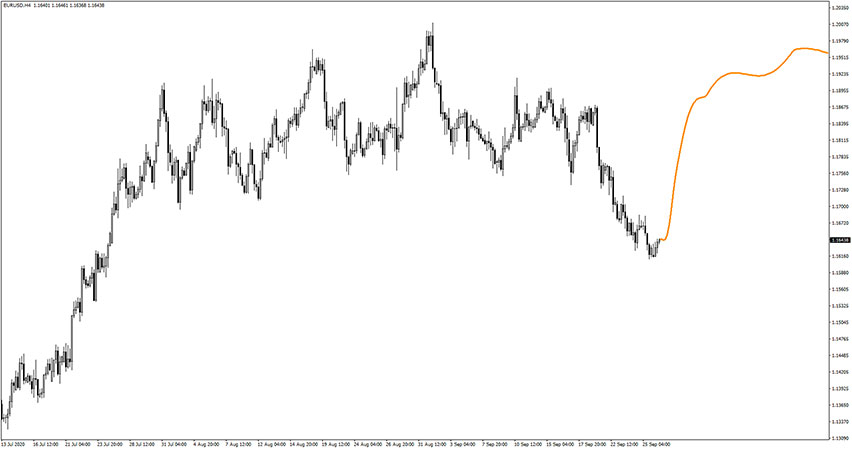
Introduction to the Fourier Extrapolator Indicator The Fourier Extrapolator indicator is a custom forex indicator based on Fourier transforms. This indicator displays the projected price movement, which is actually the result of the Fourier waves calculation. The signal is displayed in the form of a curve, which market price is supposed to follow in the…
Semafor Alert Indicator

Introduction to the Semafor Alert Indicator The Semafor Alert indicator is a custom forex trading indicator that works in a similar manner to the Zig Zag. It spots major market turning spots and additionally it marks smaller Zig Zag legs. That indicator will give you a sound alert and message popup when a signal occurs.…
Intraday Channel Breakout Indicator

Introduction to the Intraday Channel Breakout Indicator The Intraday Channel Breakout Indicator is an awesome trading tool for scalpers and intraday traders. As the name suggests, the main concept behind that gauge is to utilize breakouts and ICB does a great job at spotting them. Additionally, it colorizes candles to green or red, depending on…
SFI Entry and Exit Indicator
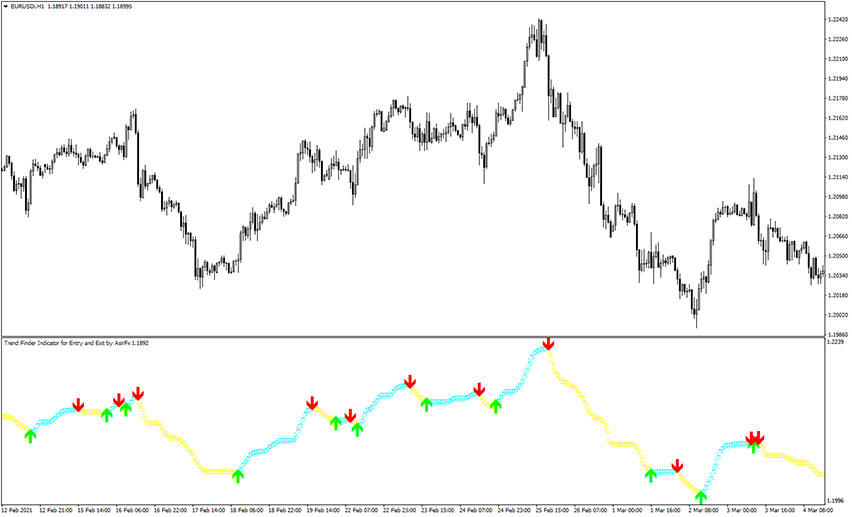
Introduction to the SFI Entry and Exit Indicator The SFI Entry and Exit indicator is a custom forex no repaint indicator that displays buy and sell arrows. The indicator is located just below the main trading chart. It fits all kinds of timeframes and currency pairs. The SFI indicator is used for forecasting price changes…