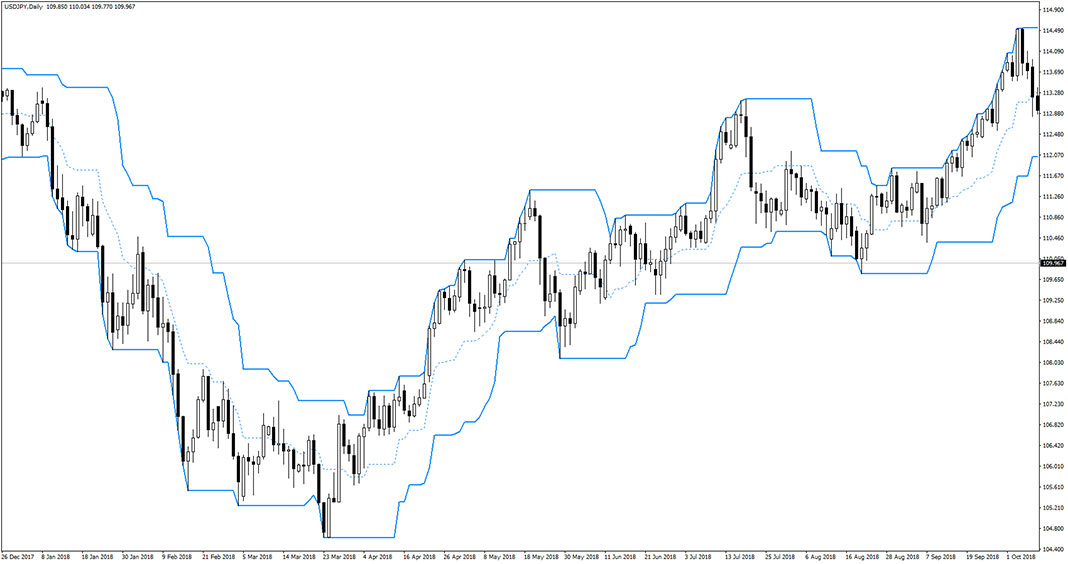
Introduction to the P Channel Indicator The P Channel Indicator is a custom forex technical analysis tool that consists of three elements: the mid-line and the two channel lines. When it comes to understanding the basic trading rules with this one, it is pretty straightforward. Simply look for buy opportunities when the price is above…
Category: Forex MT4 Indicators
MA2 Cross AA Cross & Signal Indicator
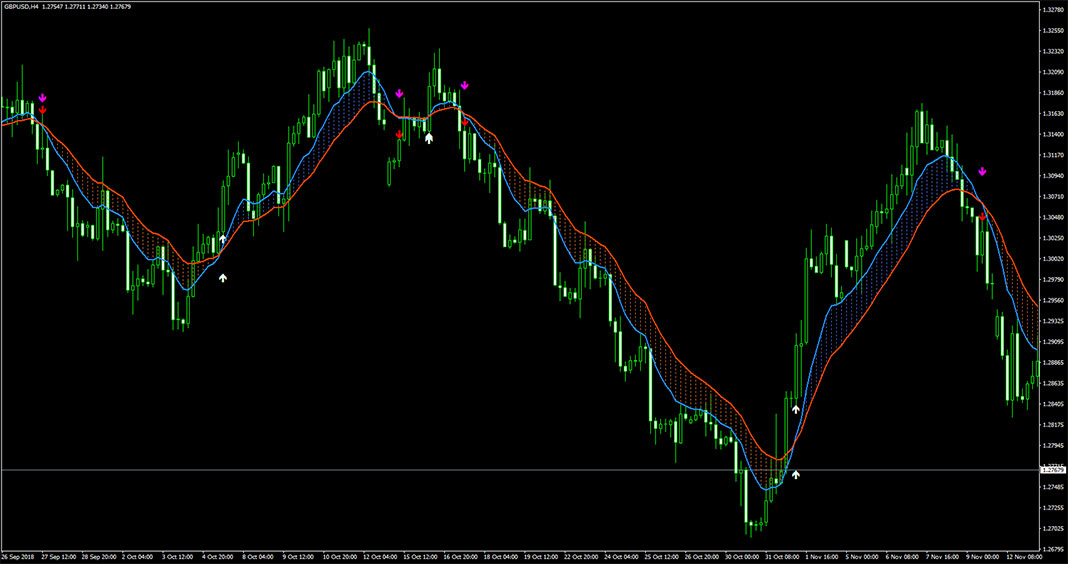
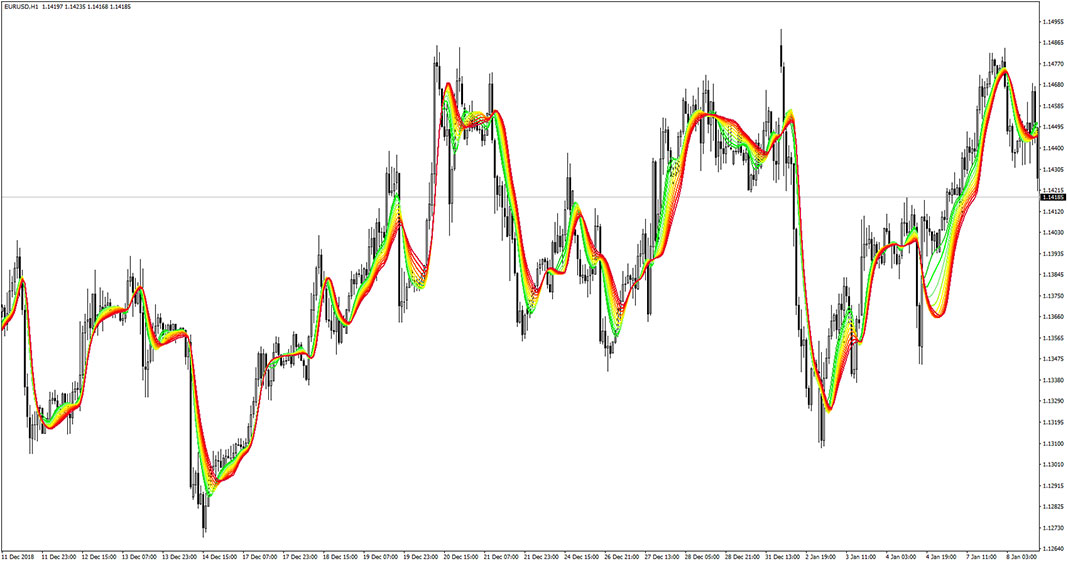
Introduction to the MA2 Cross AA Cross & Signal Indicator The MA2 Cross AA Cross & Signal Indicator is a custom forex technical analysis that displays buy/sell arrows as trading signals and two moving averages. In fact, this tool consists of three indicators. The indicator is displayed directly on the main trading chart. It fits…
Bounce Strength Indicator
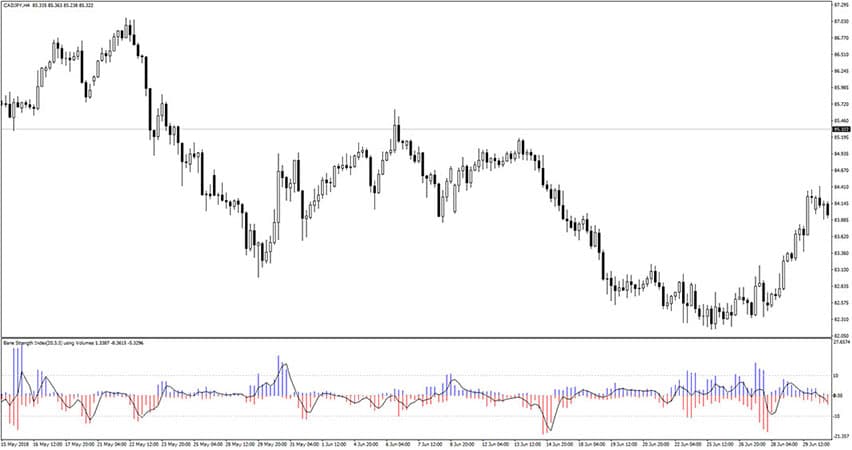
Introduction to the Bounce Strength Indicator The Bounce Strength Indicator is a forex technical analysis tool that shows the strength of a market bounce. The indicator is located in a separate window placed just below the main trading chart. The strength of the buyers and sellers in the market is displayed in the form of…
Dynamic Zone RSI Indicator
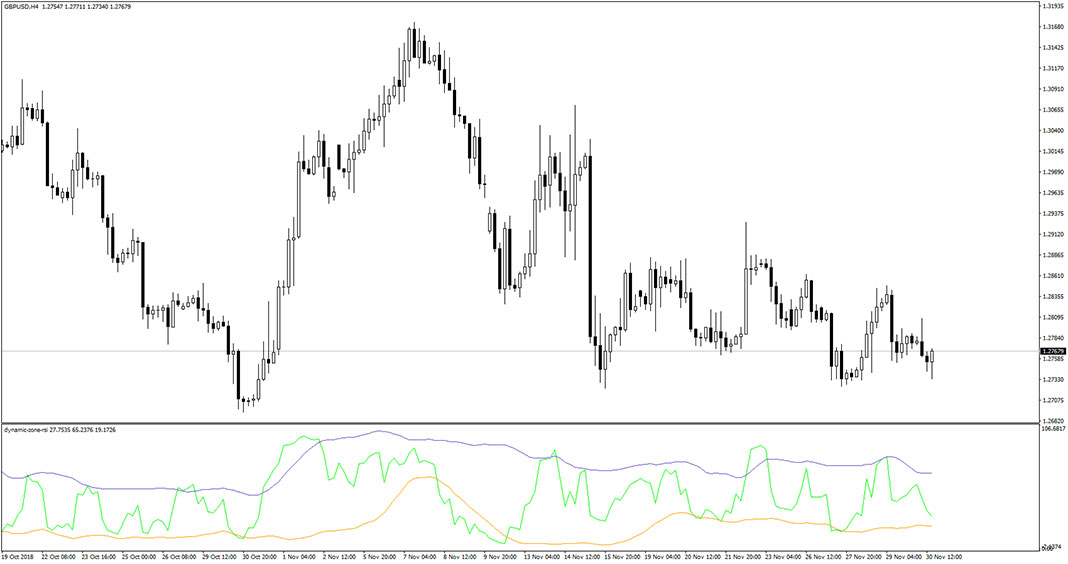
Introduction to the Dynamic Zone RSI Indicator The Dynamic Zone RSI Indicator is a forex technical analysis tool that combines RSI and two floating bands. The indicator is displayed in a separate window placed just below the main trading chart. The bands act in a similar manner to support and resistance. The purple band acts…
Visual MACD Indicator
Introduction to the Visual MACD Indicator The Visual MACD Indicator is a forex technical analysis tool based on Moving Average Convergence Divergence, but it is plotted directly on the main trading chart. It is a short-term trend following indicator. You should look for buy trades when the MACD wave is blue. Similarly, you should look…
Level Sensor Indicator
Introduction to the Level Sensor Indicator The Level Sensor Indicator is a forex technical analysis tool that show important market levels. It works in simmilar manner to the Market Profile. This indicator is plotted directly on the main trading chart on the right side. We suggest to use it as a filter for opening and…
Advanced Get Oscillator Indicator
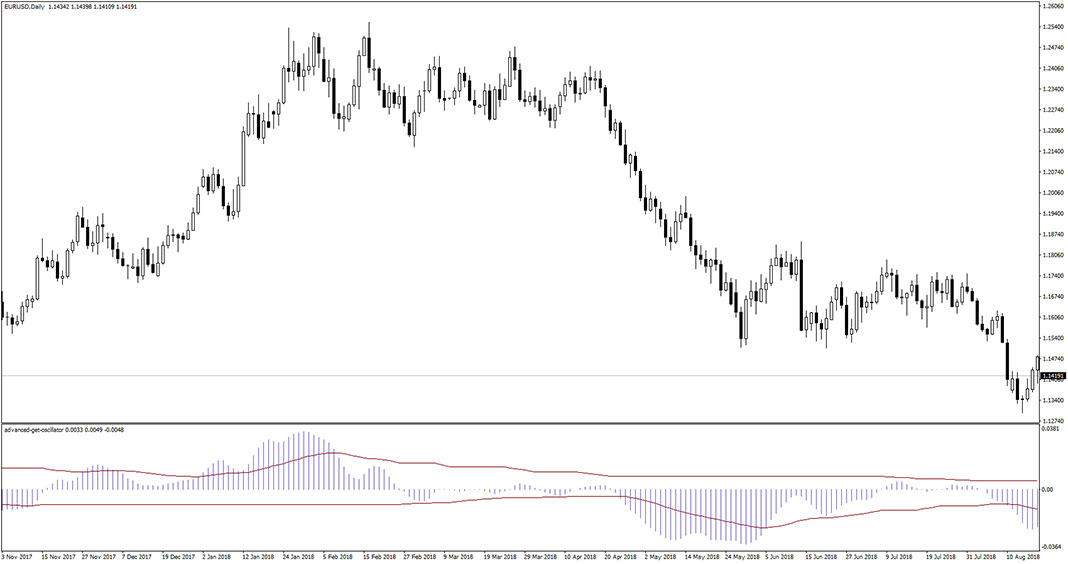
Introduction to the Advanced Get Oscillator Indicator The Advanced Get Oscillator Indicator is a custom technical analysis tool that consists of oscillator bars and two bands. The indicator is displayed just below the main trading chart in the form of a histogram that fluctuates above and below the zero level. Values above zero level reflect…
Swing Point Indicator

Introduction to the Swing Point Indicator The Swing Point Indicator is a custom forex tool that works in a very similar manner to the ZigZag indicator. The indicator is displayed directly on the main trading chart. We suggest to use it as a filter for opening and exiting transactions. Go ahead and add it to…
Super Point Signal Indicator
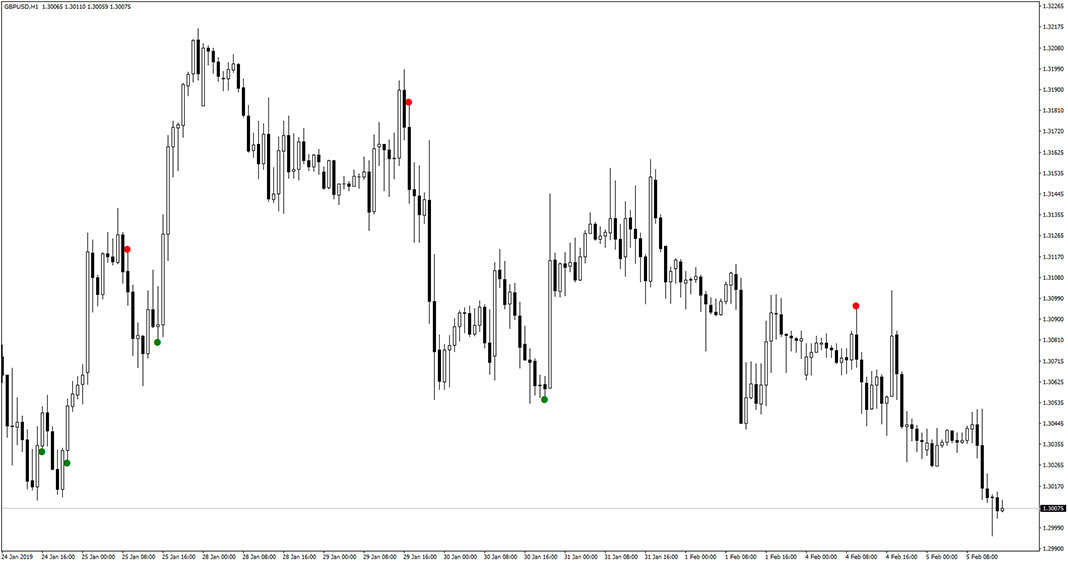
Introduction to the Super Point Signal Indicator The Super Point Signal Indicator is a simple forex trading tool that displays red and green dots as signals. When it comes to understanding trading rules, it is pretty easy to follow. When the green dot appears, this indicates a buy signal. Similarly, when the red dot appears,…
Adaptive Relative Strength Index Smoothed Indicator
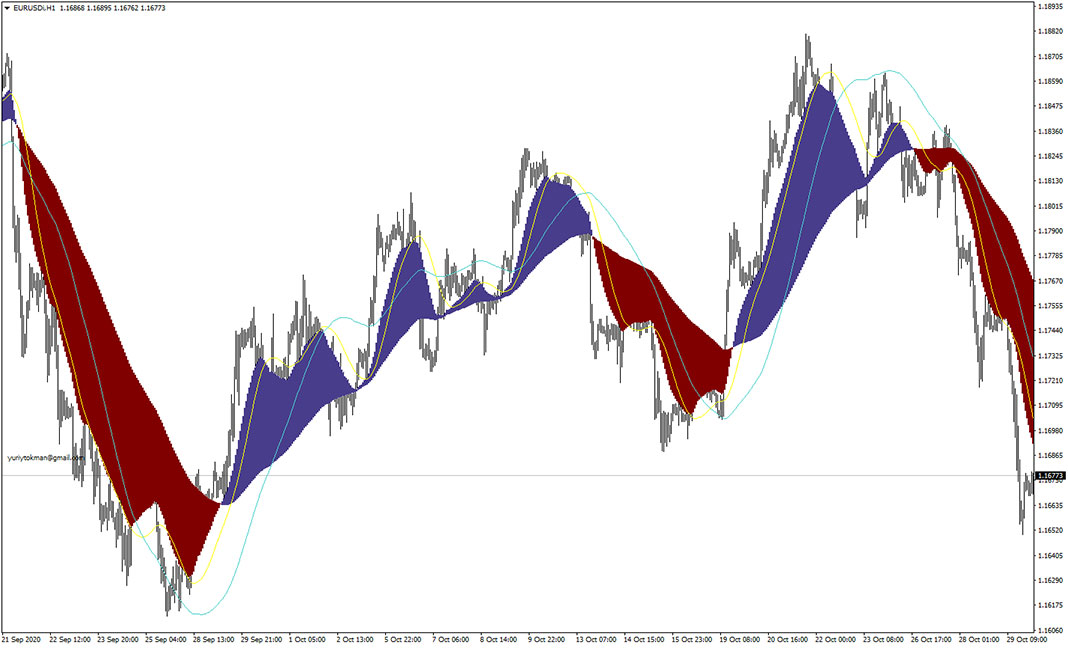
Introduction to the Adaptive Relative Strength Index Smoothed Indicator The Adaptive Relative Strength Index Smoothed is a popular trend-following forex indicator. It uses a set of moving averages based on RSI and plots a trend cloud near the price bars directly on the main chart window. Usually, when price holds its position above the cloud…