
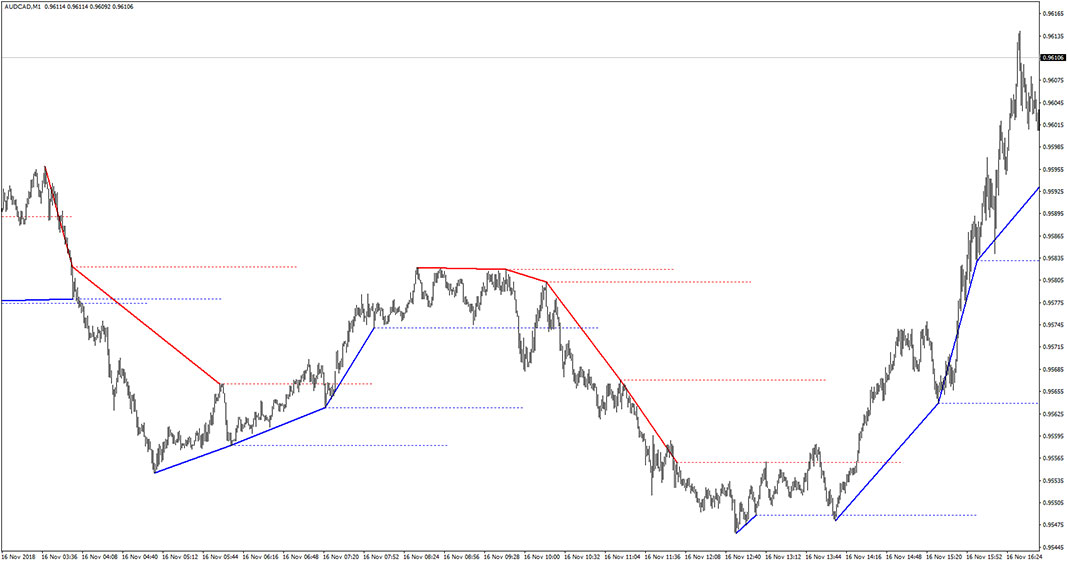
Introduction to the BO ZigZagger Indicator The BO ZigZagger Indicator is a custom forex trading tool based on the zigzag indicator. You can also use it for binary options trading. This indicator could be a good supplement to your trading system and confirmation of trade entry points and exit points. Additionally, it displays buy sell…
Category: Forex MT4 Indicators
Candle Direction Indicator
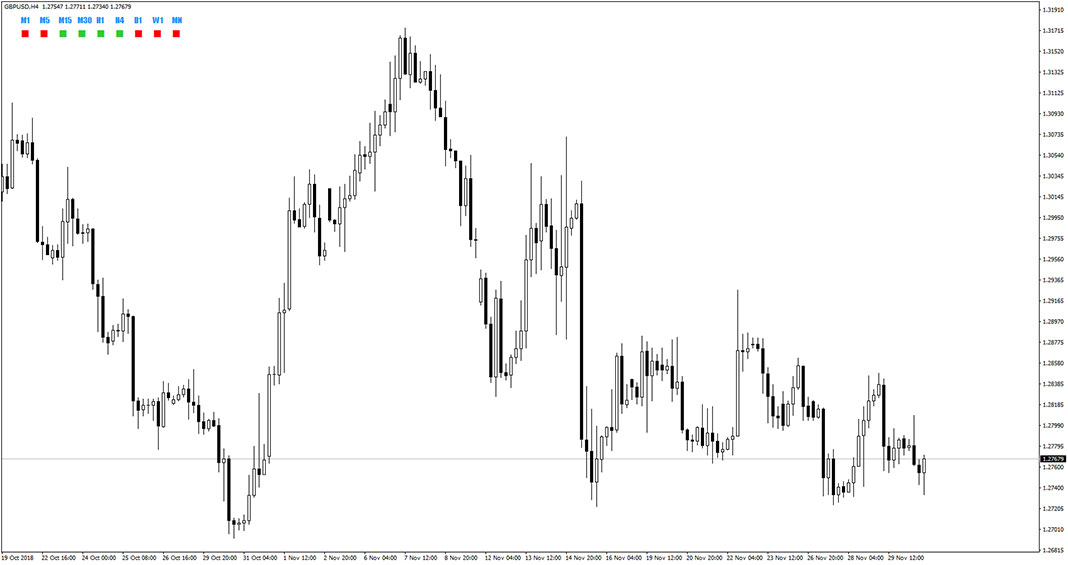
Introduction to the Candle Direction Indicator The Candle Direction Indicator is a convenient forex tool that shows if the current candles of other time frames are bullish and bearish. It is very useful for traders utilizing multiple time frame (MTF) analysis. This indicator is displayed in the top left corner of the main chart. You…
Three Line Break Indicator
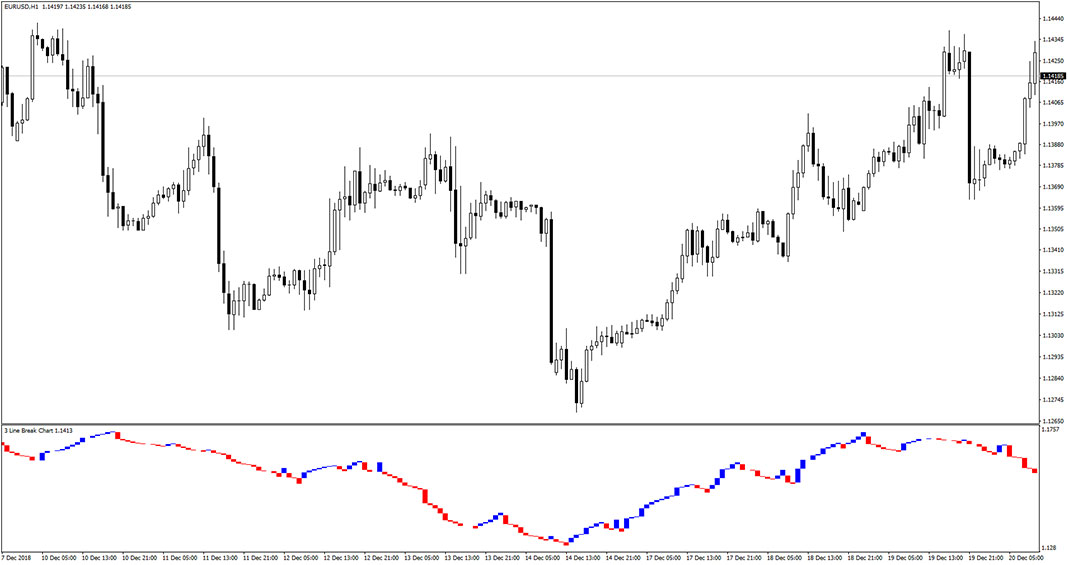
Introduction to the Three Line Break Indicator The Three Line Break Indicator (TLB) is a forex trading tool represent a raw of the vertical rectangle, the height of which is determined by the value of price changes. These charts – like Kagi, P&F, Renko – do not consider the time factor. This graphical method is…
Stochastic Elasticity Indicator
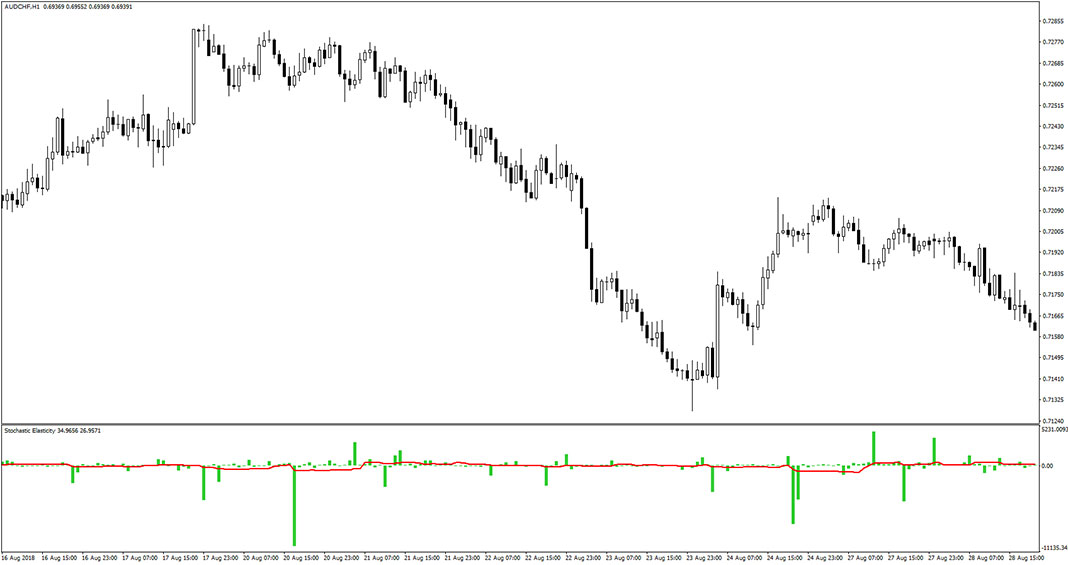
Introduction to the Stochastic Elasticity Indicator The Stochastic Elasticity Indicator is a forex trading tool that tries to predict a change in price direction. The higher bar occurs, the higher probability of trade reversal is underway. You can use it to support your trade entry points and exit decisions. We suggest utilizing it as an…
Cristal Ball Signal Indicator
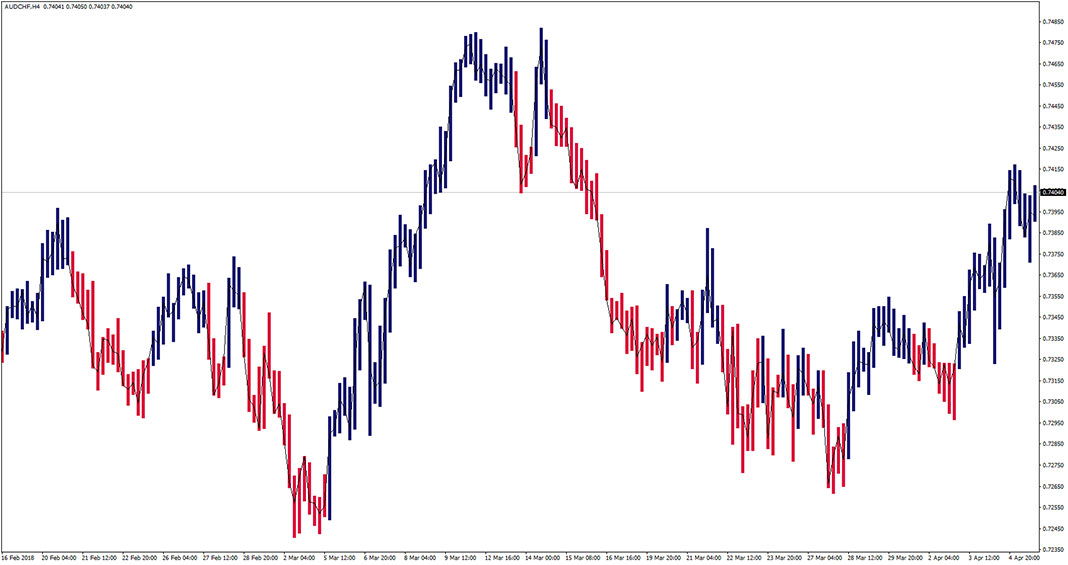
Introduction to the Cristal Ball Signal Indicator The Cristal Ball Signal Indicator is a forex trading tool that colorizes candlesticks to dark blue and dark green. These colors reflect market trends. While there are blue candles look for buying trade opportunities. Similarly, when there are red candles look for selling trade opportunities. This indicator is…
Price EMAs Indicator
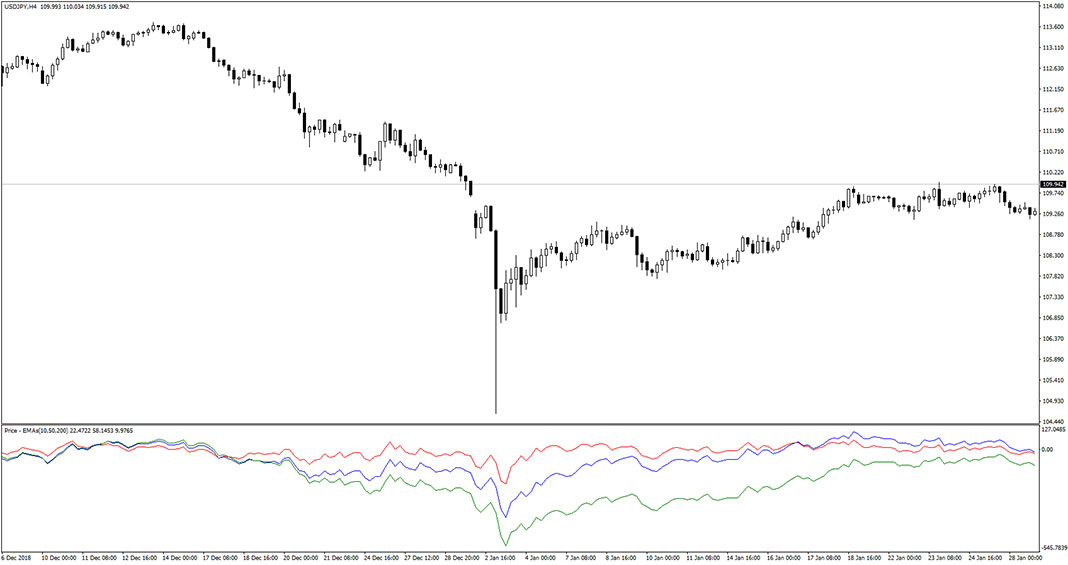
Introduction to the Price EMAs Indicator The Price EMAs Indicator displays the distance between the open price and 3 different periods exponential moving averages (EMAs) in pips. The default periods of MAs are 10, 50, and 200. The general idea behind that gauge is to define market trends and the formula is pretty simple. When…
RPoint Indicator
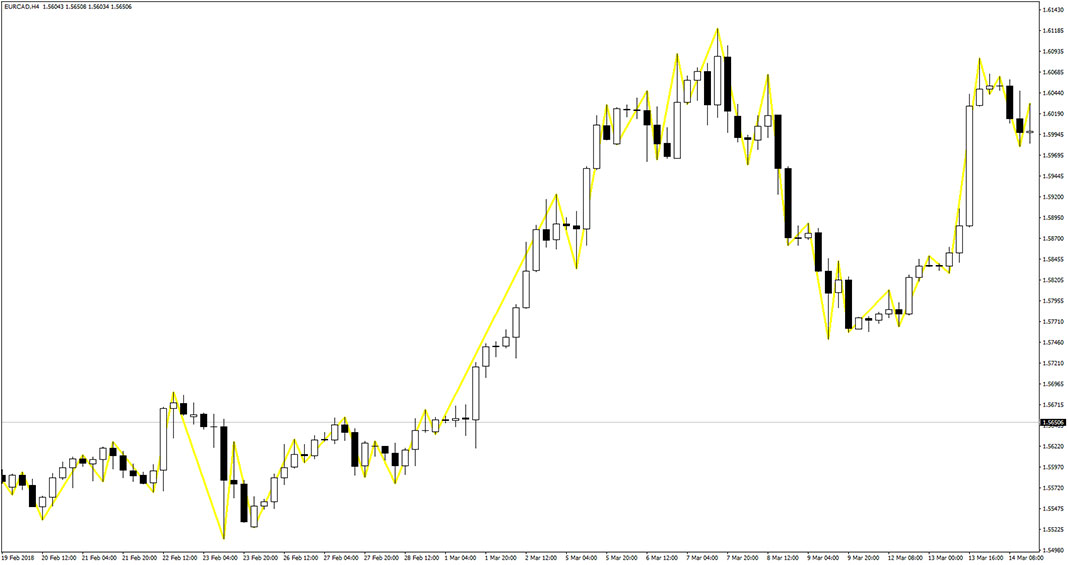
Introduction to the RPoint Indicator The RP Indicator is a forex trading tool that displays X-points reversal on the charts. The indicator works in a similar manner to Zig Zig, on the basis of HiLo. Forex entry points of that gauge should be supported with the help of some other technical analysis filters. It fits…
Forecasting Indicator
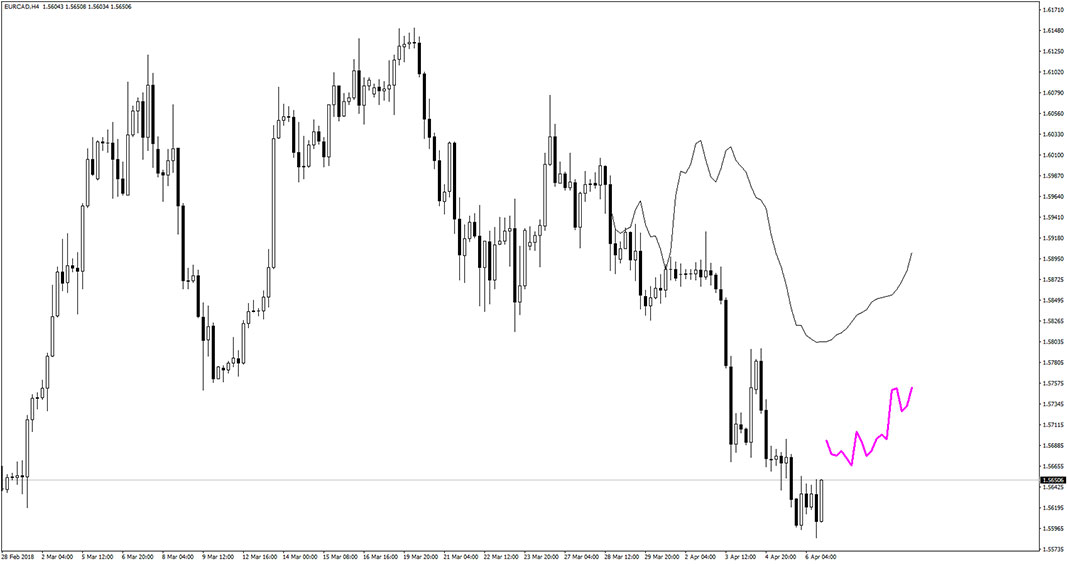
Introduction to the Forecasting Indicator The Forecasting Indicator is, as the name suggests, a forex trading tool that tries to predict market moves in the nearest future. On the right side of your chart, you will notice the pinkish line that reflects the next price movement. Don’t trade that gauge alone, but rather use it…
STO JMA Indicator
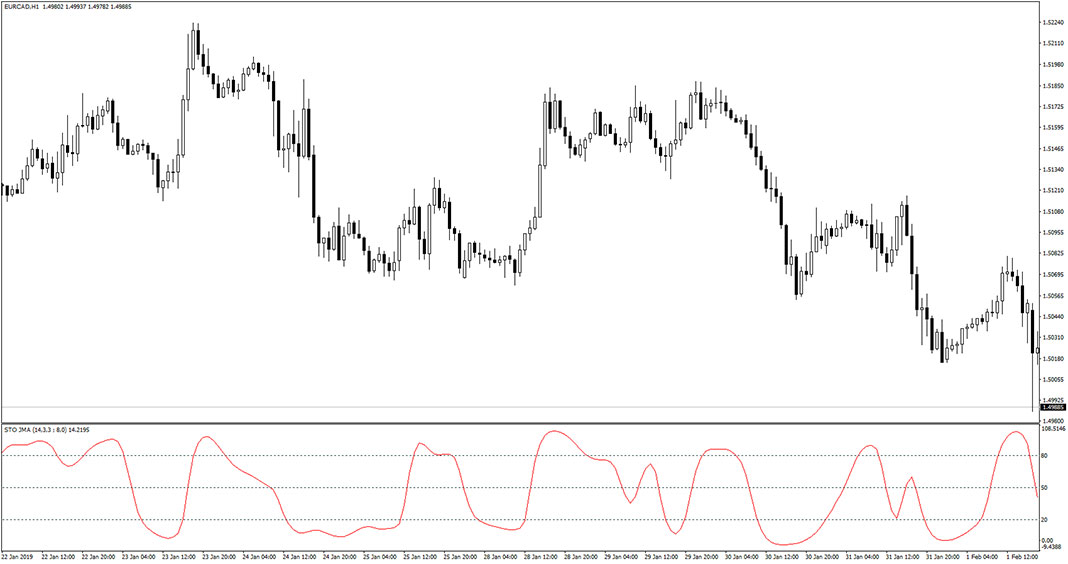
Introduction to the STO JMA Indicator The STO JMA Indicator is a custom forex oscillator. Like all oscillators, this one also shows overbought and oversold market levels. When that oscillator line reaches below 20 level, it means the price is oversold and you should be looking for a buy trade opportunity. Similarly, when the oscillator…
Dadas True Trend Indicator
Introduction to the Dadas True Trend Indicator The Dadas True Trend Indicator is a trend momentum forex trading tool. It fits all kinds of timeframes and currency pairs. By default, it will work perfectly at lower timeframes like M1 or M5. If you want to trade at higher timeframes, change the “TF” option in the…