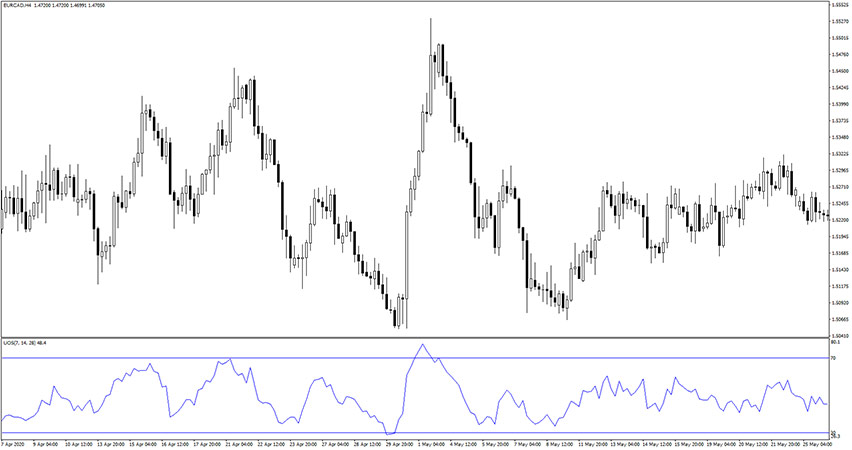
Introduction to the Ultimate Oscillator Indicator The Ultimate Oscillator Indicator was developed by Larry Williams. That oscillator applies a weighted average of values of three stochastic indicators defined on short, medium, and long periods. The length of periods is usually in the correlation 1:2:4 (doubling) or 1:2:3 (multiplicity). Periods should be chosen according to the…
Category: Forex MT4 Indicators
Vidya Zone Multi Time Frame Indicator

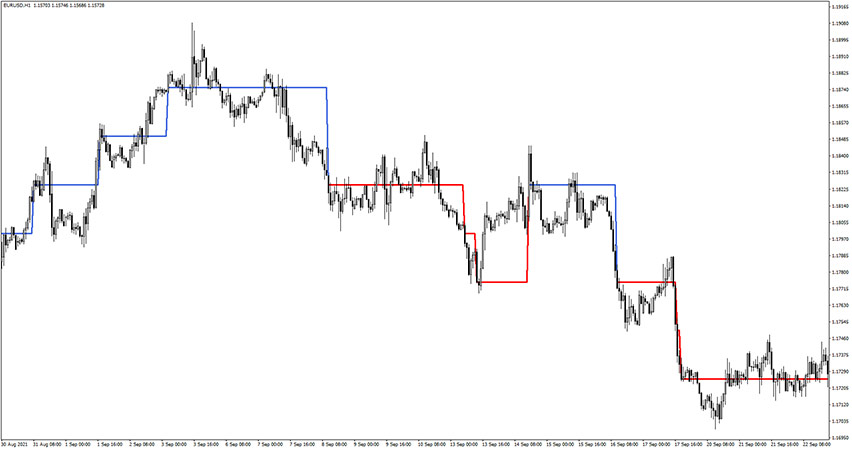
Introduction to the Vidya Zone Multi Time Frame Indicator The Vidya Zone Multi Time Frame Indicator displays an trend-following channel based on the Variable Index Dynamic Average. It is also an multi time frame indicator, so you can choose the custom time frame for provided signals. When the price is above the blue band of…
RSX RSI Bar Chart Indicator
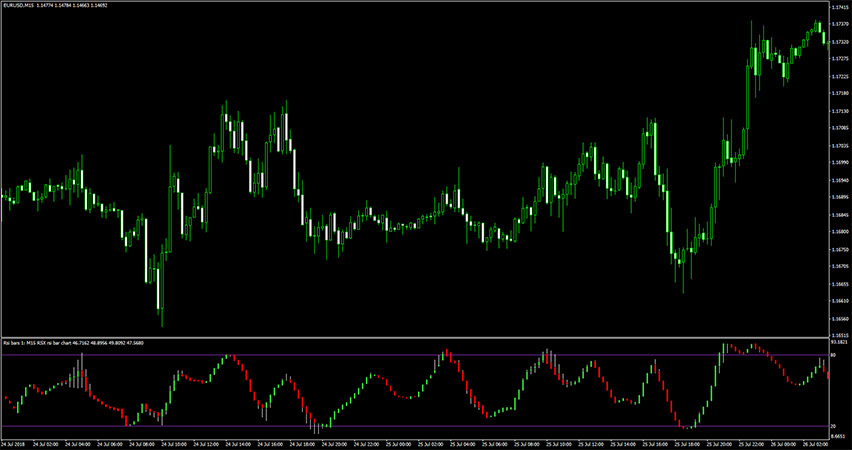
Introduction to the RSX RSI Bar Chart Indicator The RSX RSI Bar Chart Indicator displays custom bars calculated based on the Relative Strenght Index and the RSX indicator. Pay attention to the 20 and 80 levels, which are respectively oversold and overbought zones. When its bars falls below 20 level, the price will make a…
Turn Area Forex Indicator

Introduction to the Turn Area Forex Indicator The Turn Area Forex Indicator is a combination of Relative Strength (RSI) and Exponential Moving Average (EMA). The signals are represented in a form of the histogram bars that can reach overbought/oversold levels (20/-20 respectively). Due to the nature of its signals, that forex indicator can be considered…
Parabolic Marsi Adaptive MACD Alerts Indicator
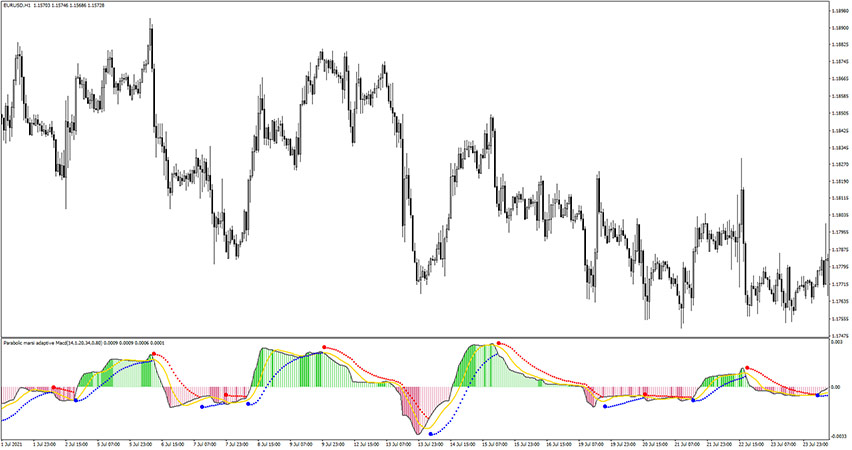
Introduction to the Parabolic Marsi Adaptive MACD Alerts Indicator The Parabolic Marsi Adaptive MACD Alerts Indicator is, as the name suggests, a combination of the Parabolic Sar, and Adaptive MACD indicators into one trading tool. A buy trade is triggered when the indicator provides blue Parabolic Sar Dots under MACD. Conversely, a sell trade is…
AG Renko Chart Buy Sell Indicator
Introduction to the AG Renko Chart Buy Sell Indicator The AG Renko Chart Buy Sell Indicator is a simple, but effective forex trading tool that provides Renko based buy and sell signals on the activity chart. That forex indicator plots a blue/red line – its color depends on the trade direction. It definitely helps in…
ZigZag On Parabolic Indicator

Introduction to the Zigzag On Parabolic Indicator The ZigZag On Parabolic Indicator is, as the name suggests, a combination of the ZigZag and Parabolic Sar indicators into one trading tool. When you load up the indicator, on the activity chart you will see the aqua lines of the Zig Zag and blue dots of the…
CCI Arrow No Repaint Buy Sell Indicator
Introduction to the CCI Arrow No Repaint Buy Sell Indicator The CCI Arrow No Repaint Buy Sell Indicator is, as the name suggests, a forex trading tool based on Commodity Channel Index (CCI), but its signals are provided in a form of the buy/sell arrows. Moreover, it’s a no repaint indicator, therefore signals once placed…
Stochastic Divergence Indicator

Introduction to the Stochastic Divergence Indicator The Stochastic Divergence Indicator automatically recognizes divergences between price and Stochastic Oscillator. When the signal is spotted, it plots a buy/sell arrow accordingly. That technique defines the potential reversal of the market. The Stochastic Divergence Indicator fits all kinds of timeframes and currency pairs. It is displayed in a…
Break Mid BB Indicator
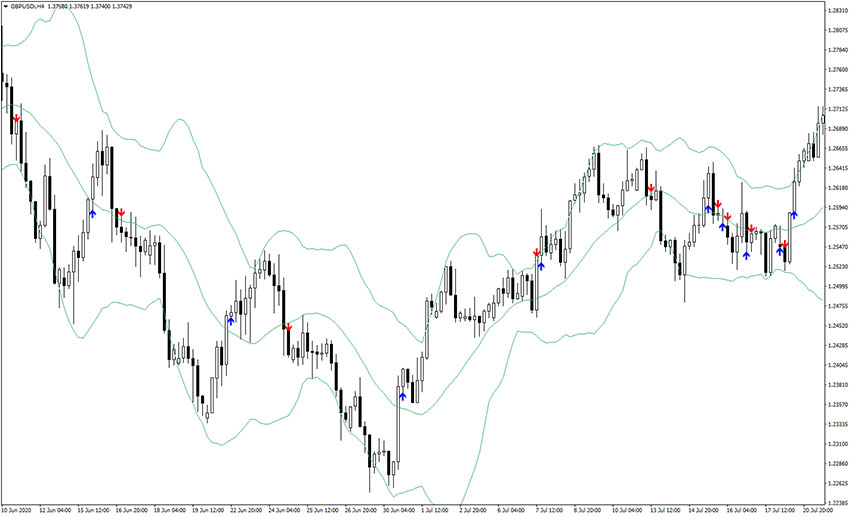
Introduction to the Break Mid BB Indicator The Break Mid BB Indicator does exactly what its name suggests, it displays buy/sell arrows at the break of the middle line of the Bollinger Bands indicator. These signals however shouldn’t be used as a standalone trading tool, but rather as a supplement to proved strategy based on…