Introduction to the Engulfing Candle Indicator The Engulfing Candle Indicator is a forex technical analysis tool that comes in handy when you need engulfing bars recognized automatically. It simply relieves the hassle of looking for engulfing candlesticks and picking them manually. There are two types of engulfing patterns – the bullish and bearish engulfing. That…
Category: Forex MT4 Indicators
Stochastic RSI Indicator

Introduction to the Stochastic RSI Indicator The Stochastic RSI Indicator (Stoch RSI) was developed to increase the sensitivity and reliability of the regular RSI indicator when it comes to trading off overbought/oversold RSI levels. In other words, it is used in forex technical analysis to provide a stochastic calculation to the RSI indicator. Of course,…
HMA Trend Indicator
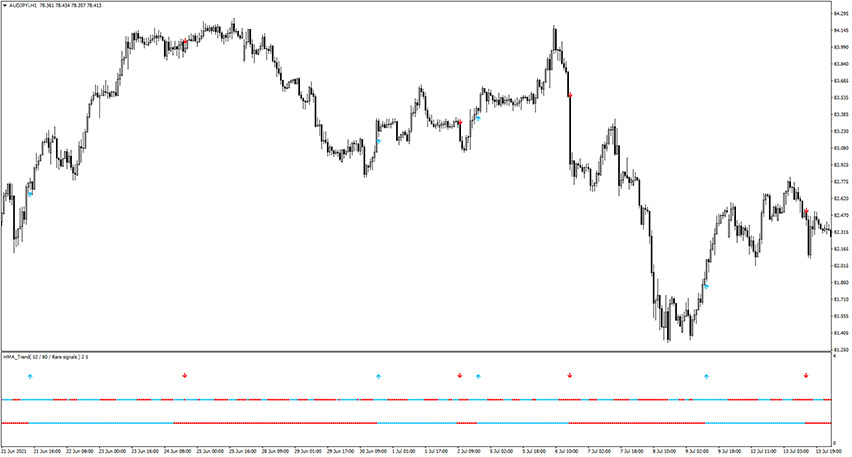
Introduction to the HMA Trend Indicator The HMA Trend Indicator is, as the name suggests, a trend forex indicator based on the Hull Moving Average with two periods. A combination of two types of Hull Moving Averages makes better use of these advantages: HMA with a slow period identifies the trend, while HMA with a…
Linear Regression Indicator

Introduction to the Linear Regression Indicator The Linear Regression Indicator plots a highly sensitive moving average line that quickly responds to price action shifts and movements. The traditional moving averages tend to be lagging and produce late trading signals. That’s why the Linear Regression comes in handy for many forex traders. It uses better calculations,…
Marvin Non Repaint Indicator

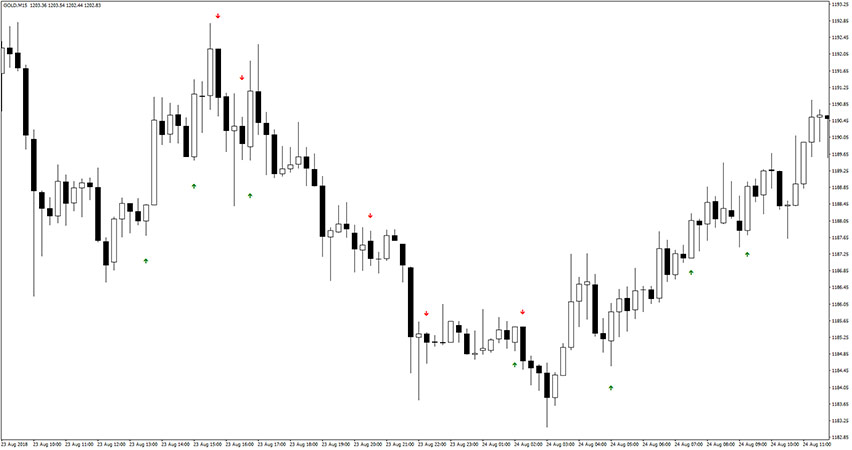
Introduction to the Marvin Non Repaint Indicator The Marvin Non Repaint Indicator tries to recognize peaks and bottoms of the market, giving the opportunity to trade great swings. As the name suggests, it is a non repaint indicator, so signals once placed, will never change their position. This is a great advantage, as you can…
VWAP Indicator

Introduction to the VWAP Indicator The VWAP indicator is actually the Volume Weighted Average Price indicator for the forex market and it shows the average true price of a currency pair, weighted by volume. If you are a beginner trader and the above description doesn’t tell you much – don’t worry, we will explain it…
MPC Indicator

Introduction to the MPC Indicator The MPC indicator is based on the channel breakout. The basic ruled that applies here is the following – the long position is opened when the price shows new X days maximum, and the short position is opened when the price forms new X day minimum. It allows forecasting the…
Donchian Channel with EMA Indicator

Introduction to the Donchian Channel with EMA Indicator The Donchian Channel with EMA is a trend-following indicator containing, as the name suggests, Donchian Channel and Exponential Moving Average. The bands of the Donchian Channel can be used to identify the trend, breakout, and volatility of the market and are calculated on high and low of…
CAM Indicator for Trends and Counter Trends
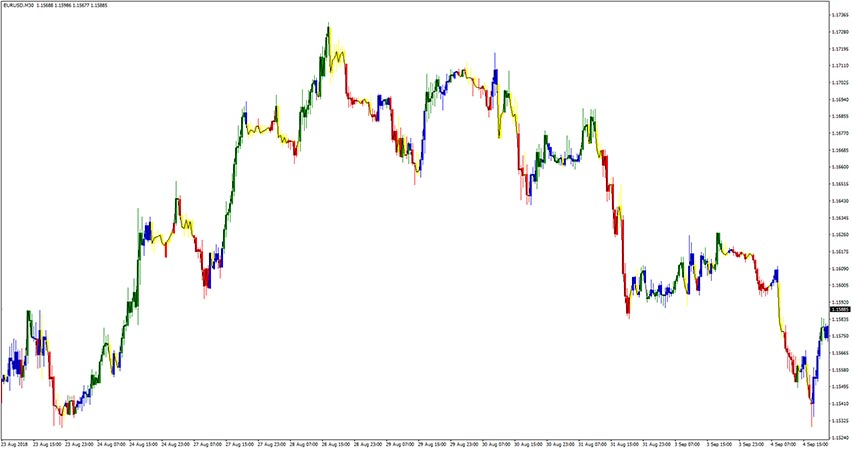
Introduction to the CAM Indicator for Trends and Counter Trends The CAM Indicator for Trends and Counter Trends overlaps colorful candlestick on the main trading chart. Green bars represent a bullish trend, red bars represent a bearish trend, blue and yellow bars shows trend change or market indecision. It fits all kinds of timeframes and…
Camarilla Pivot Points Indicator
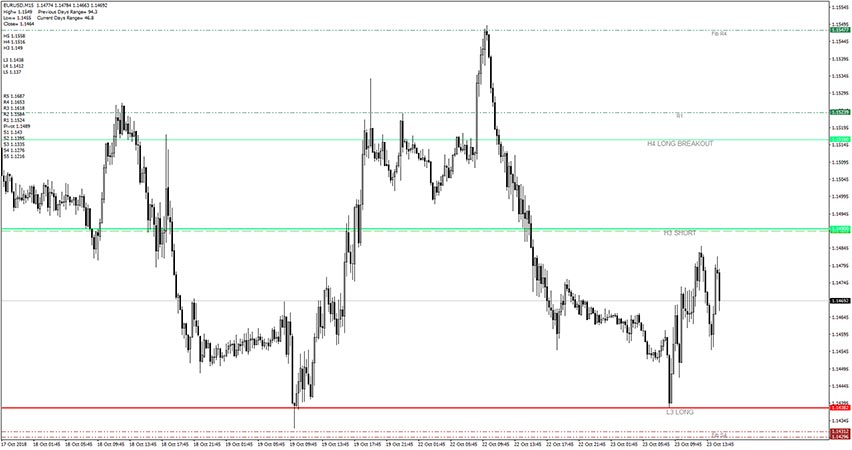
Introduction to the Camarilla Pivot Points Indicator The Camarilla Pivot Points indicator provides important market levels working as entry points or reversal turning points. The Camarilla Pivot Points indicator is a modification of the classic Pivot Point and it was introduced by Nick Scott in 1989. There are 6 main lines: H5 LB Target, H4…