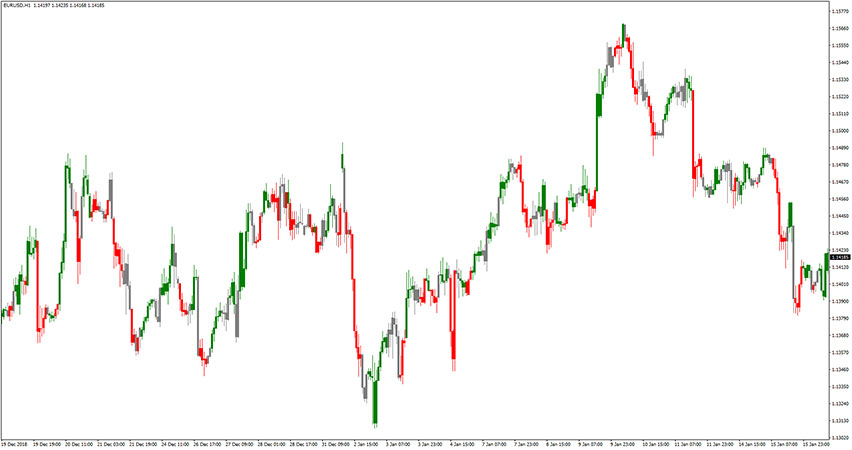
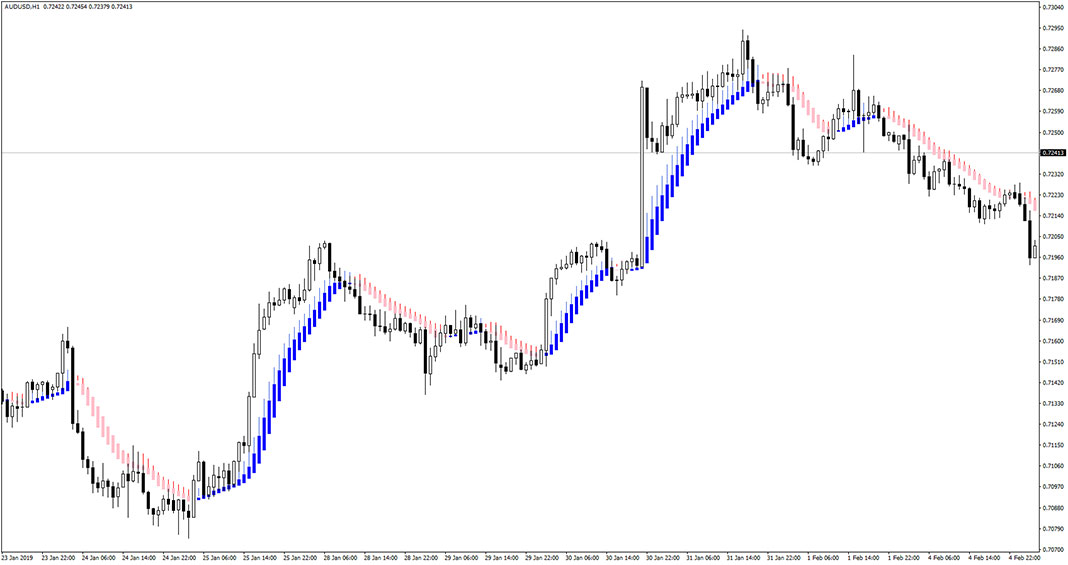
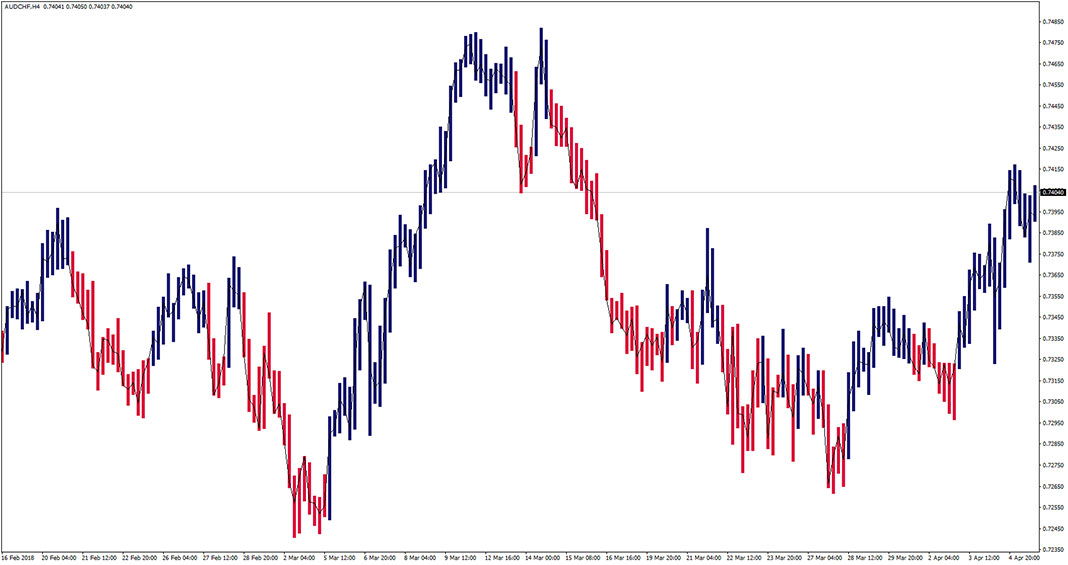
Introduction to the Zone Trade Indicator The Zone Trade is a forex indicator that uses momentum, acceleration and price confirmation for the color of candles. This approach of trading was first mentioned by Bill Williams and he calls it trading in the zone. There are three types of trade zones: Buy Zone – a candle…
Tag: candlestick indicators
RSI Divergence Candles Indicator
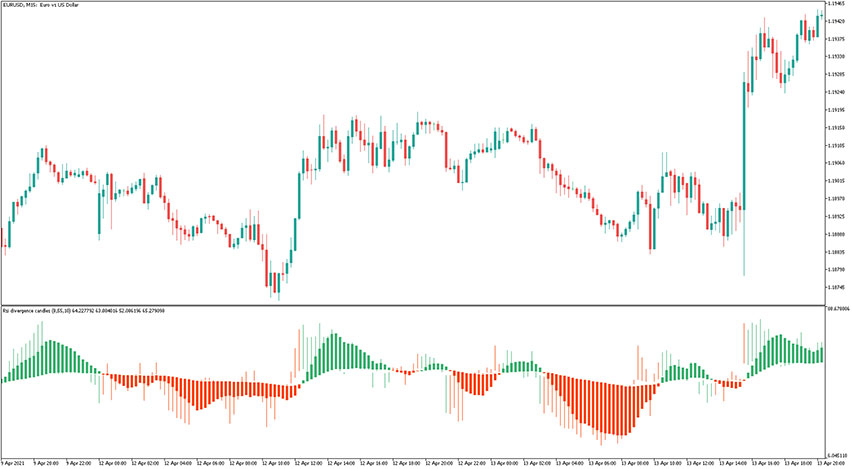
Introduction to the RSI Divergence Candles Indicator The RSI Divergence Candles indicator is a momentum oscillator that measures the speed and change of price movements. The indicator is displayed in a separate window placed just below the main trading chart. The signals are shown in the form of candles that are colored differently in a…
Pin Bar Buy Sell Indicator
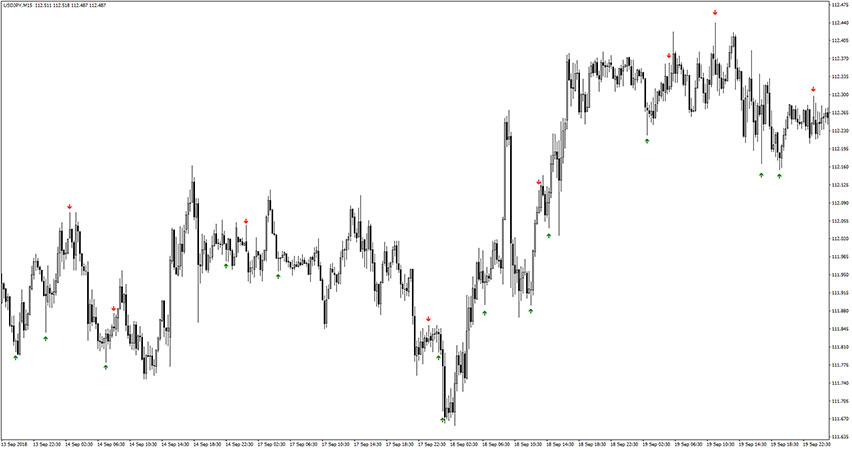
Introduction to the Pin Bar Buy Sell Indicator The Pin Bar Buy Sell indicator recognizes pin bar candlesticks and when the signal is generated it marks the triggering candles with buy/sell arrows. The indicator is displayed directly on the main trading chart. It fits all kinds of timeframes and currency pairs. The default settings can…
Heiken Ashi Smoothed Indicator
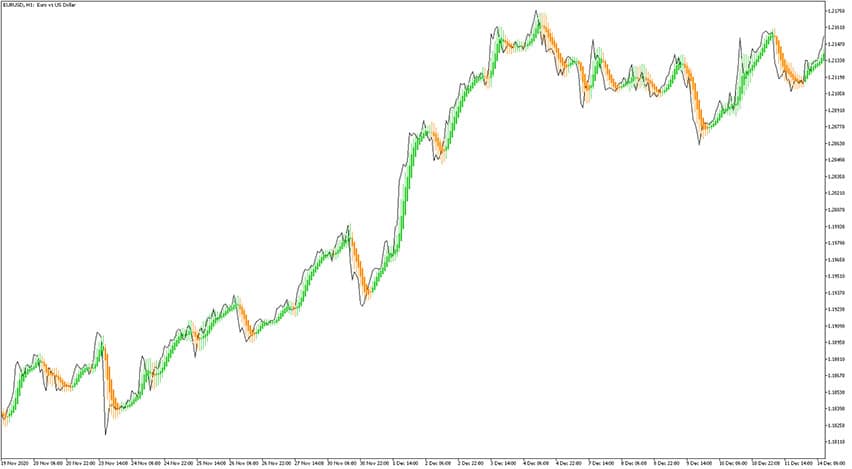
Introduction to the Heiken Ashi Smoothed Indicator The Heiken Ashi Smoothed indicator is a very popular trading tool. It helps to see clear trend momentum without much noise. The logic behind the smoothed version of Heiken Ashi candles is simple: instead of using “raw” prices” for calculations, it’s using smoothed/filtered/averaged prices instead. That usually filters…
Heiken Ashi Smoothed Alert
Introduction to the Heiken Ashi Smoothed Alert Indicator The Heiken Ashi Smoothed Alert Indicator is, as the name suggests, just a variation of the standard Heiken Ashi Smoothed but it additionally gives alerts when the trend is changing. You will get notifications: CandleDir changed to LONG or CandleDir changed to SHORT. The indicator is displayed…
DAT ASB Indicator
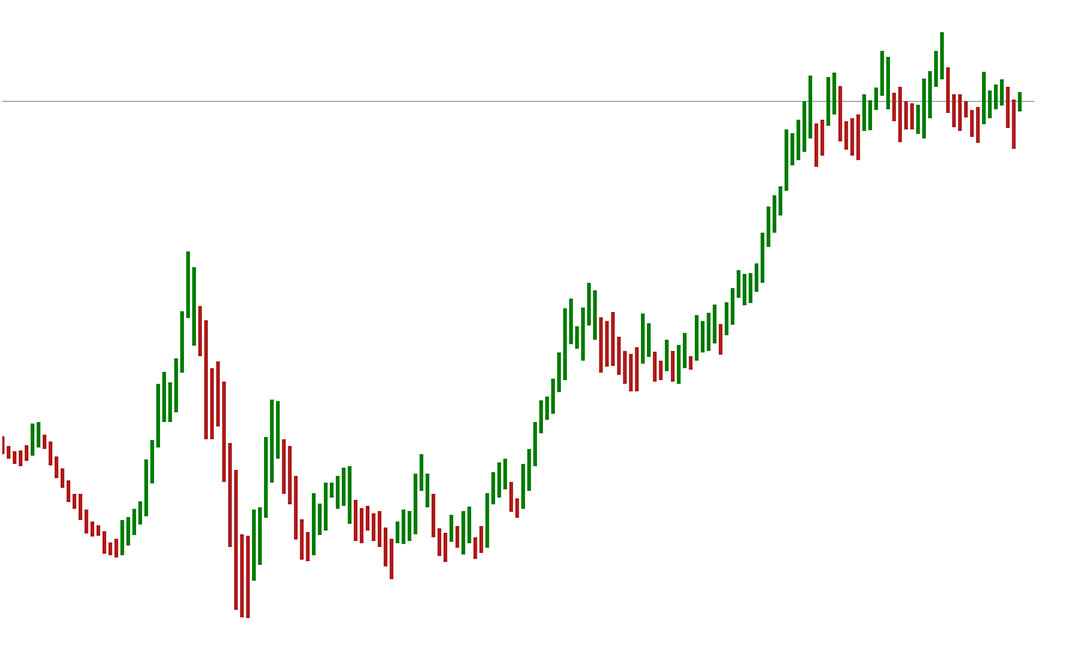
Introduction to the DAT ASB Indicator The DAT ASB Indicator is a custom forex trading tool that colorizes bars depedning on the trend direction. Simply look for buy trades when the candles are green. Similarly, look for sell trades when the candles are red. We suggest to use it as a filter for opening and…
Candle Direction Indicator
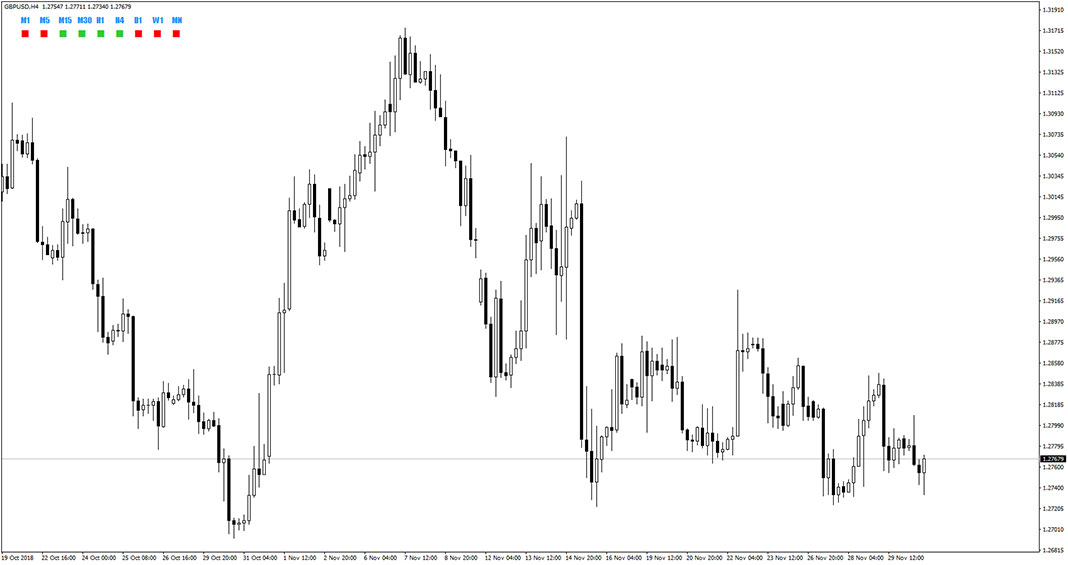
Introduction to the Candle Direction Indicator The Candle Direction Indicator is a convenient forex tool that shows if the current candles of other time frames are bullish and bearish. It is very useful for traders utilizing multiple time frame (MTF) analysis. This indicator is displayed in the top left corner of the main chart. You…
Three Line Break Indicator
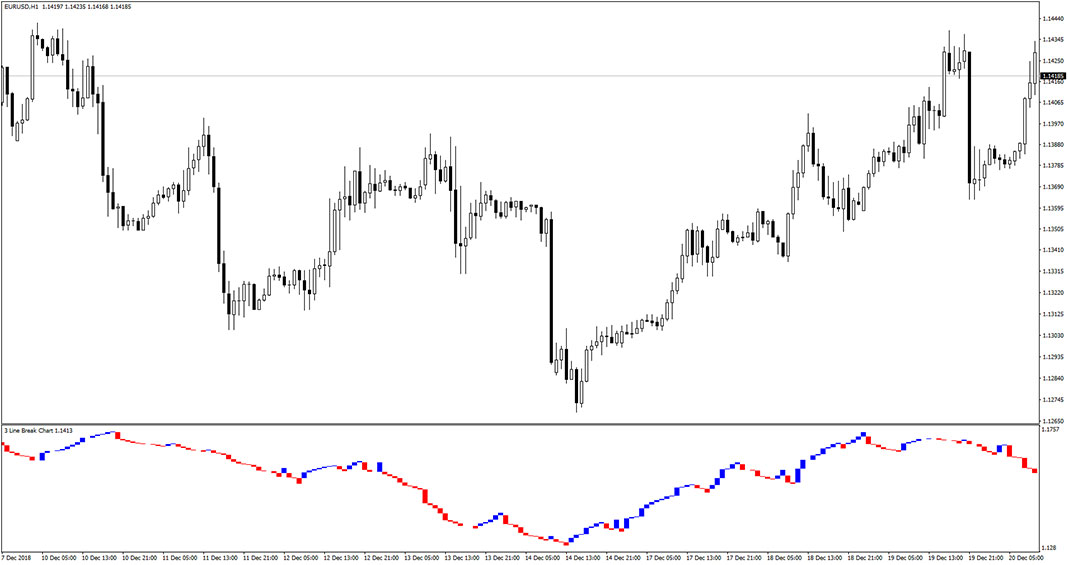
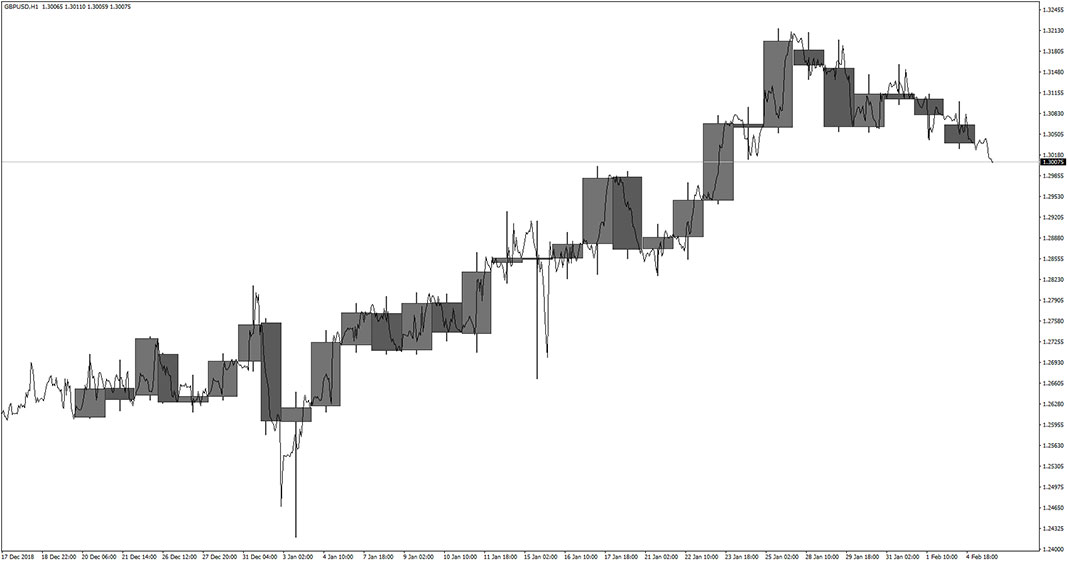
Introduction to the Three Line Break Indicator The Three Line Break Indicator (TLB) is a forex trading tool represent a raw of the vertical rectangle, the height of which is determined by the value of price changes. These charts – like Kagi, P&F, Renko – do not consider the time factor. This graphical method is…
Cristal Ball Signal Indicator
Introduction to the Cristal Ball Signal Indicator The Cristal Ball Signal Indicator is a forex trading tool that colorizes candlesticks to dark blue and dark green. These colors reflect market trends. While there are blue candles look for buying trade opportunities. Similarly, when there are red candles look for selling trade opportunities. This indicator is…
M-Candles Indicator
Introduction to the M-Candles Indicator The M-Candles Indicator is a simple but useful tool that displays bigger time frame candles in your current TF chart. By default, it is set to show daily candles on an hourly chart. You can use it for spotting accurate trade entries and exits when using technical analysis of higher…