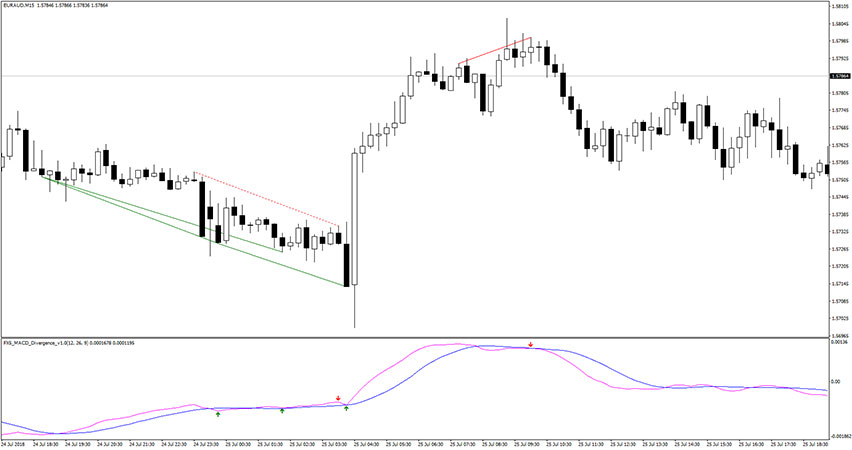
Introduction to the FX5 MACD Divergence Indicator The FX5 MACD Divergence indicator draws divergence lines on the MACD indicator and will give buy and sell signals by displaying green and red arrows. It also has a built-in alert function. As the original indicator, bullish divergence is plotted in green lines while bearish divergence is plotted…
Tag: divergence indicators
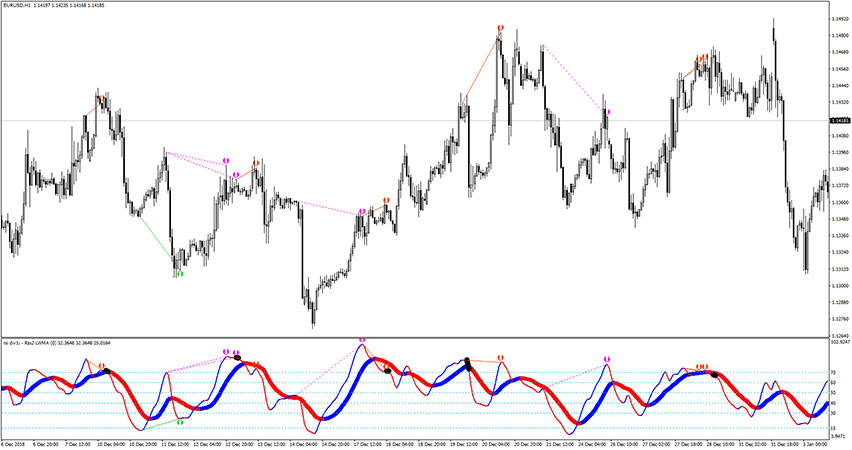
RSI Slope Divergence Indicator MTF
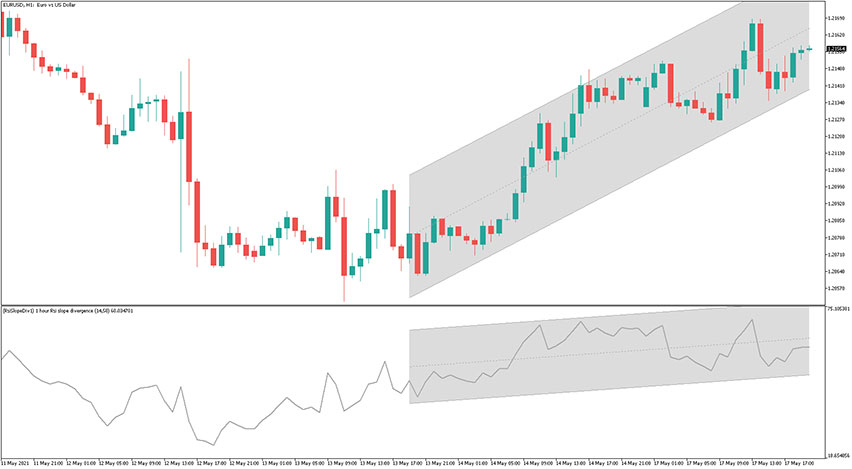
Introduction to the RSI Slope Divergence Indicator MTF The RSI Slope Divergence indicator MTF plots two linear regression channels: directly on the price and on the Relative Strength Index (RSI). It is a multi-timeframe indicator. The general usage of that gauge is divergences detection, but also correction or retracement even before it occurs. The indicator…
RSI Divergence Alert Indicator
Introduction to the RSI Divergence Alert Indicator The RSI Divergence Alert indicator is a custom variation of the Relative Strength Index indicator that provides alerts when buy/sell signals occur. It fits all kinds of timeframes and currency pairs. The indicator is displayed in a separate window placed just below the main trading chart. The default…
All In One Divergence Indicator
Introduction to the All In One Divergence Indicator The All In One Divergence indicator recognizes and marks divergences between price and the Relative Strength Index (RSI) technical indicator. There are two types of divergences: bullish (upward price move) and bearish (downward price move). It is pretty easy to follow the signals, simply follow these suggestions:…
RSI Divergence Candles Indicator
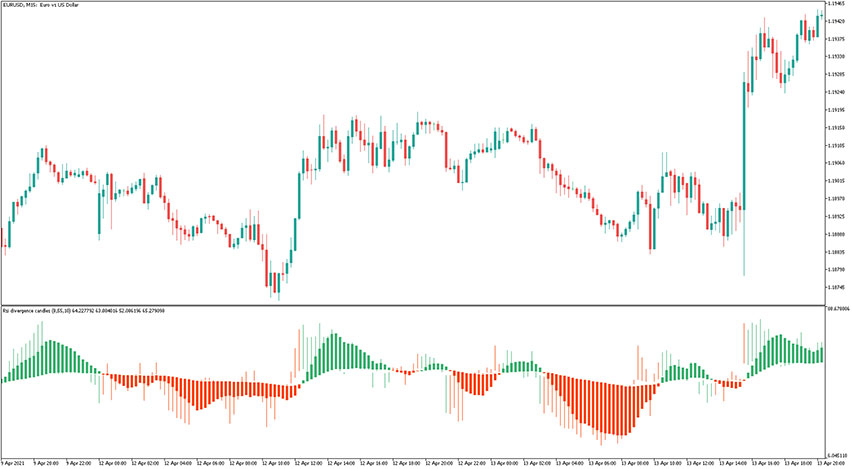
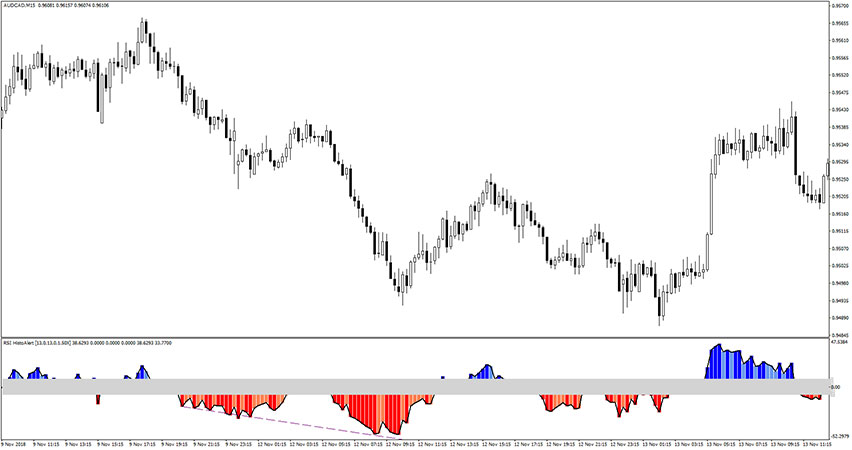
Introduction to the RSI Divergence Candles Indicator The RSI Divergence Candles indicator is a momentum oscillator that measures the speed and change of price movements. The indicator is displayed in a separate window placed just below the main trading chart. The signals are shown in the form of candles that are colored differently in a…
RSI & CCI Divergence EA
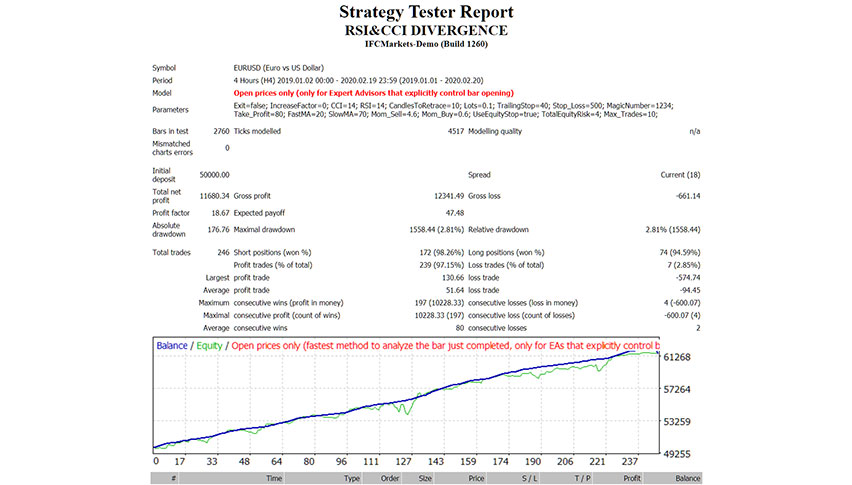
Introduction to the RSI & CCI Divergence EA The RSI & CCI Divergence EA is a forex automatic trading robot that executes buy and sell transactions when there is a divergence between price and RSI or CCI. It has Trailing Stop Loss & Take Profit features. The “IncreaseFactor” function – if you lose a trade…
RSIMA Baseline Divergence Arrows Indicator
Introduction to the RSIMA Baseline Divergence Arrows Indicator The RSIMA Baseline Divergence Arrows indicator works great at filtering those divergence signals. Divergences are only visible on this indicator if: If RSI MA is outside 80 Overbought, Bearish Divergence signal will appear (to forecast a reversal to the downside); If RSI MA is outside 20 Oversold,…
Sibbet Demand Index Divergence Indicator
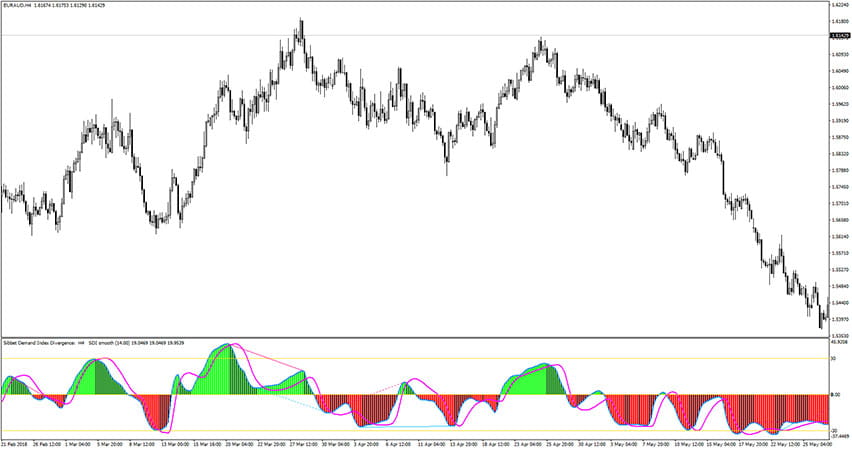
Introduction to the Sibbet Demand Index Divergence Indicator The Sibbet Demand Index Divergence indicator is a custom forex trading indicator that uses the moving average of the price data. It helps traders to understand whether the bullish or bearish movement in the price is getting stronger or weaker. That gauge is made of the histogram…
MACD Divergence Indicator
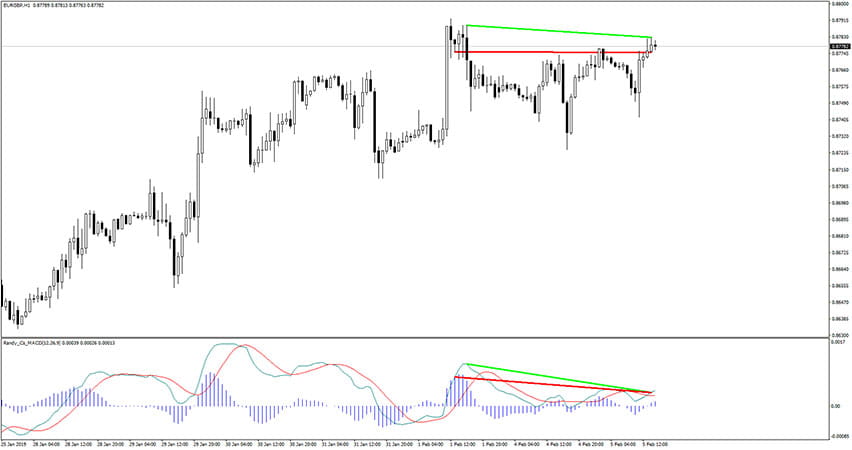
Introduction to the MACD Divergence Indicator The MACD Divergence indicator is a forex trading tool based on the well-known Moving Average Convergence / Divergence indicator. It recognizes, spots, and displays divergences. Additionally, it will draw divergence lines. Reaction from these lines will be a good entry point. The indicator is displayed in a separate window…
MFI RSI Divergence Indicator
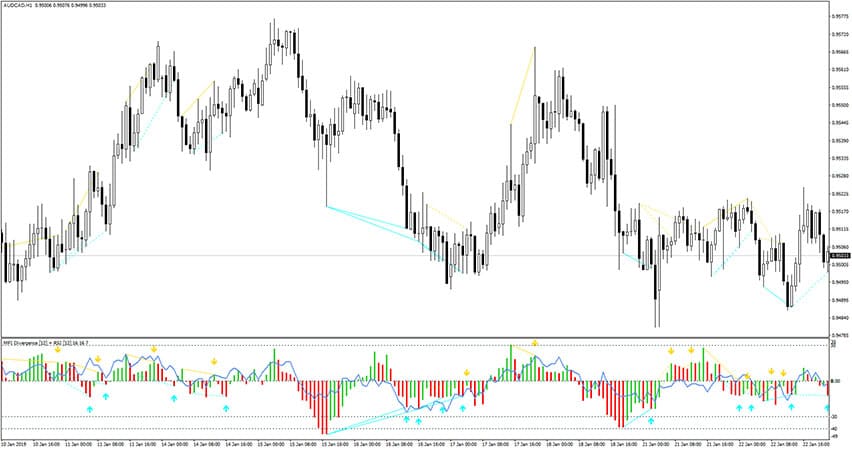
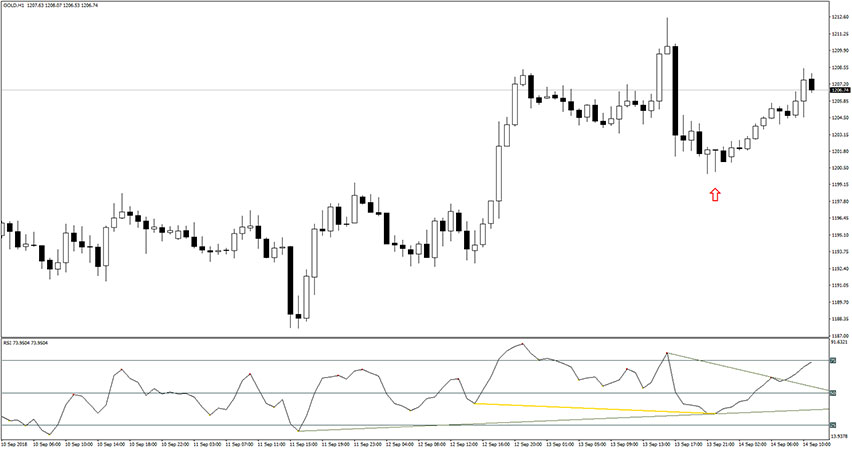
Introduction to the MFI RSI Divergence Indicator The MFI RSI Divergence indicator is a forex tool based on Money Flow Index and Relative Strenght Index. It recognizes, spots, and displays divergence. Additionally, it provides buy/sell arrows for bullish and bearish divergences. We suggest using it for entries and exit ideas or as a filter in…