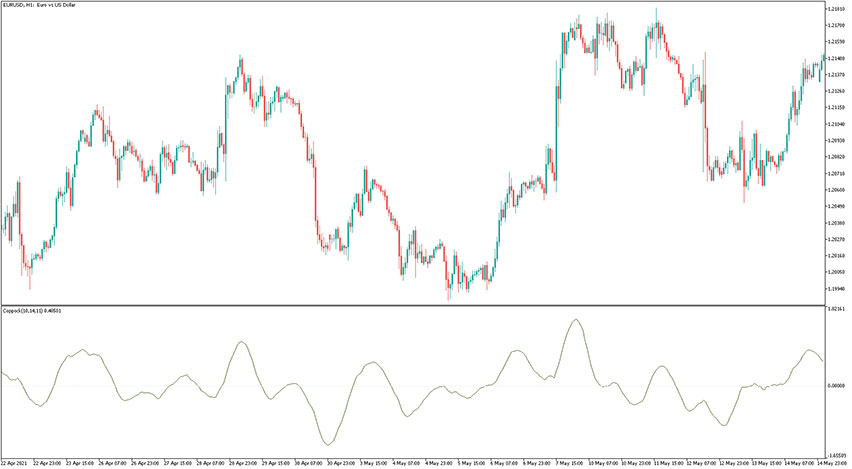
Introduction to the Coppock Indicator The Coppock indicator is a custom forex indicator that works like an oscillator recognizing market trends. That indicator was first introduced by Edwin Sedgwick Coppock in 1962. He published the formula for calculating the Coppock indicator in the Barron’s Magazine. The formula used in calculating the Coppock does not take…
Tag: oscillator indicators
Price Cycle Indicator
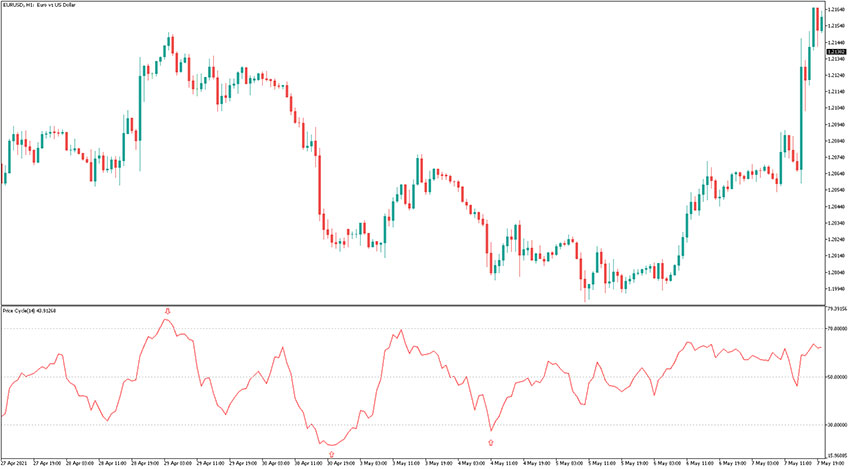
Introduction to the Price Cycle Indicator The Price Cycle (PC) indicator is a custom forex oscillator that is used by traders to reveal market cycles in the short and long term periods. A market cycle is defined by series of repeated patterns and that gauge does pretty well in spotting such patterns. The indicator is…
ADMIR Indicator
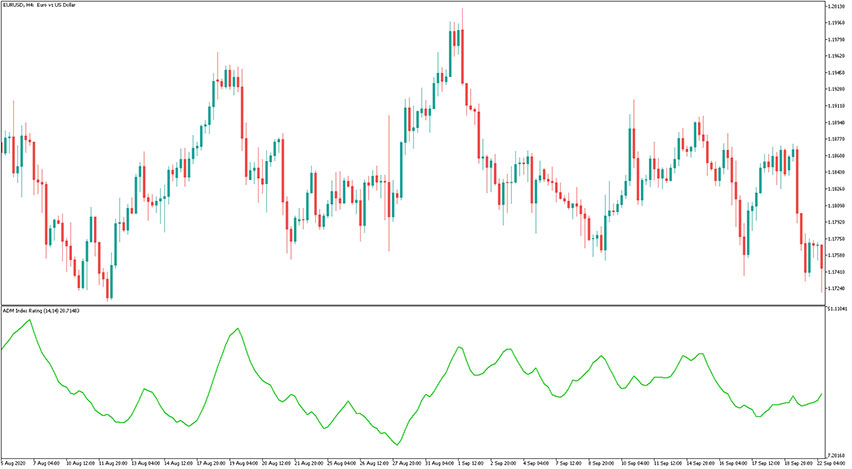
Introduction to the ADMIR Indicator The ADMIR indicator is a forex oscillator, that name means Average Directional Movement Index Rating. It reveals the ratio of the ADX lines of two indicators, Average Directional Movement Index along with the calculation periods conflicting by the listed value. The indicator is displayed in a separate window placed just…
Percent Difference Oscillator Indicator
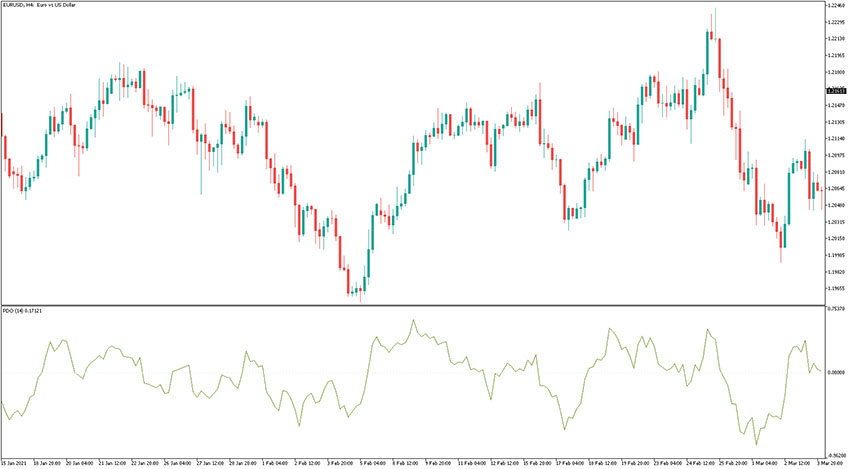
Introduction to the Percent Difference Oscillator Indicator The Percent Difference Oscillator (PDO) indicator is, as the name suggests, an oscillator that shows the difference between the moving average and the current close price. Results are provided as the percent of the moving average (above or below the MA). The formula for the Percent Difference Oscillator…
Three Moving Averages Convergence/Divergence (MAxCD) Indicator
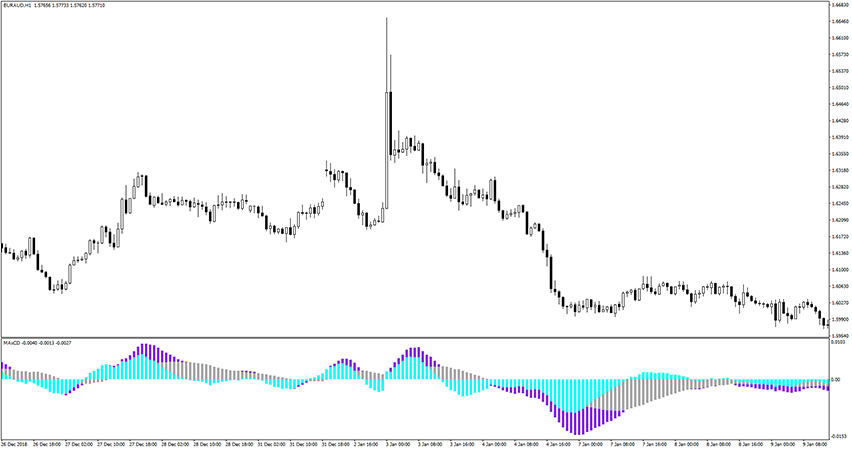
Introduction to the Three Moving Averages Convergence/Divergence (MAxCD) Indicator The Three Moving Averages Convergence/Divergence (MAxCD) indicator also known as MAxCD, is a signal oscillator that consists of three moving averages. This forex indicator draws three colored histogram bars that float above and below the zero level. Each color of the histogram bar represents each moving…
Trend Direction Force Indicator
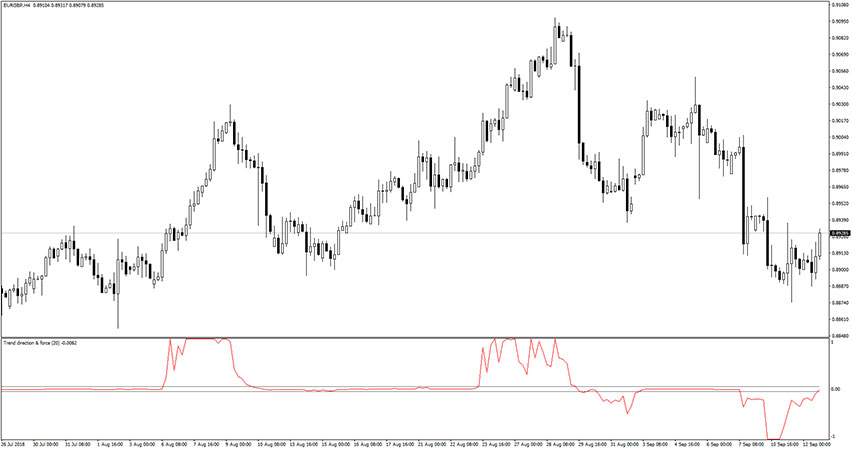
Introduction to the Trend Direction Force Indicator The Trend Direction Force indicator is a trend-following buy/sell signal oscillator that works really well. The signal line moves between extreme values of 1 and -1. Most of the time it hovers around 0 level, and the signal occurs when it shoots up or down. It fits all…
Center Of Gravity Oscillator
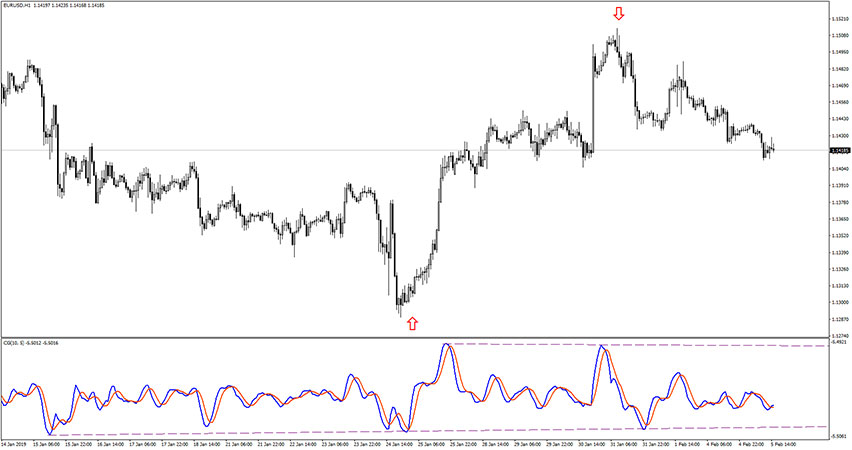
Introduction to the Center Of Gravity Oscillator The Center Of Gravity Oscillator produces nearly zero lag readings of the market corrections and turning points (pivot points) with high accuracy. That indicator is a result of years of studies of adaptive filters by John Ehler and was developed and presented in Stocks & Commodities magazine in…
CMO Smoothed Indicator
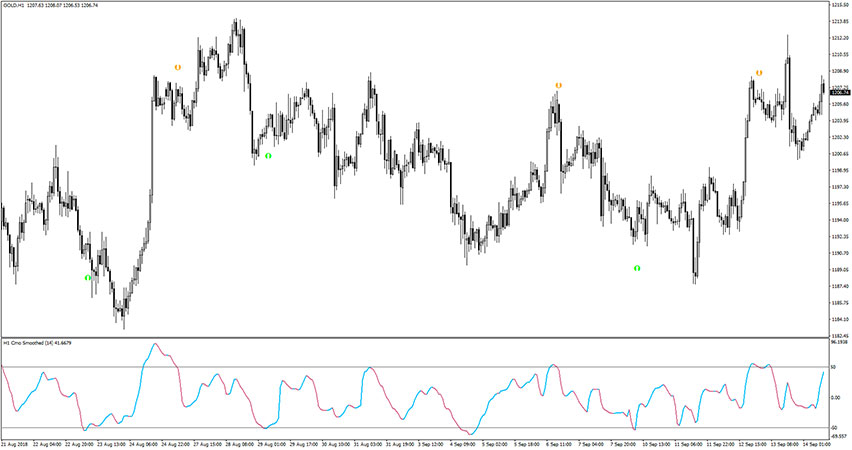
Introduction to the CMO Smoothed Indicator The CMO Smoothed indicator is based on Chande Momentum Oscillator but it uses smoothed price for its formula calculations. It is an oscillator so the signal line moves between overbought (50) and oversold (-50) levels. Usually, when the price is overbought – you should be looking for sell opportunities.…
Ehlers Histogram Oscillator Indicator
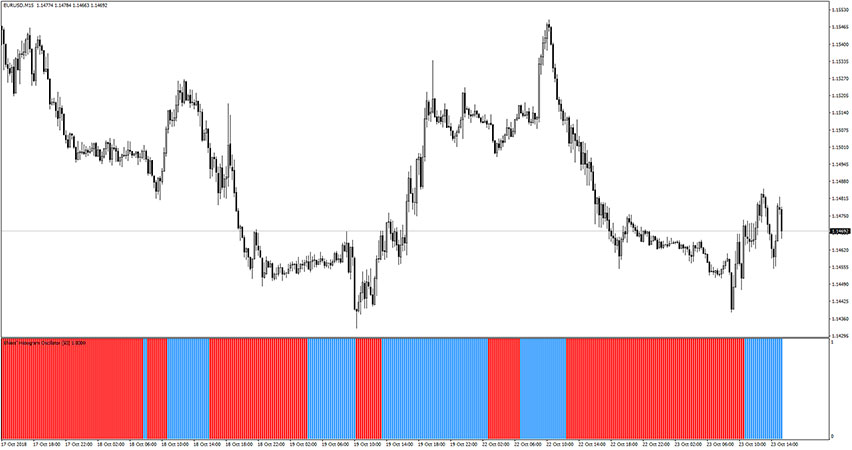
Introduction to the Ehlers Histogram Oscillator Indicator The Ehlers Histogram Oscillator indicator, as the name suggests, shows Ehlers signals in the form of histogram bars. These signals are really easy to read: simply the blue bars mean opportunities for buy trades, and the red bars mean opportunities for sell trades. The EHO can work as…
Elliott Wave Oscillator Indicator
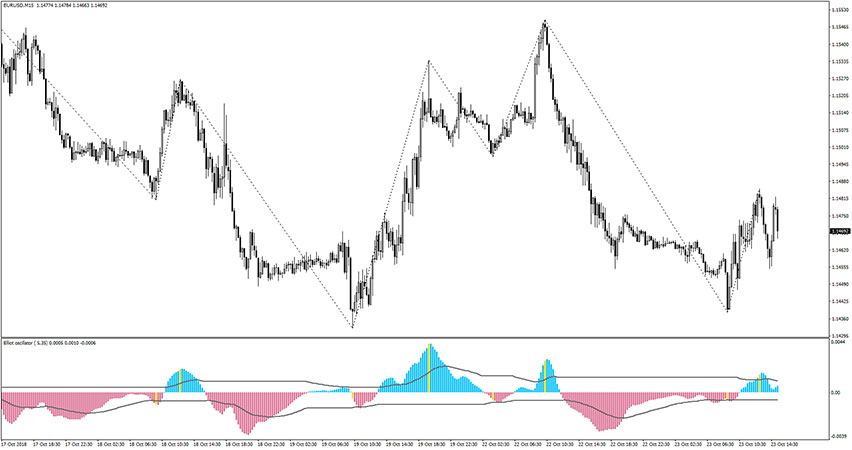
Introduction to the Elliott Wave Oscillator Indicator The Elliott Wave Oscillator indicator technically is the difference between a 5-period and 35-period simple moving average (SMA) based on the close of each candlestick. It’s helpful in determining where an Elliott wave ends and a new one starts. In other words, determining when the market price movement…