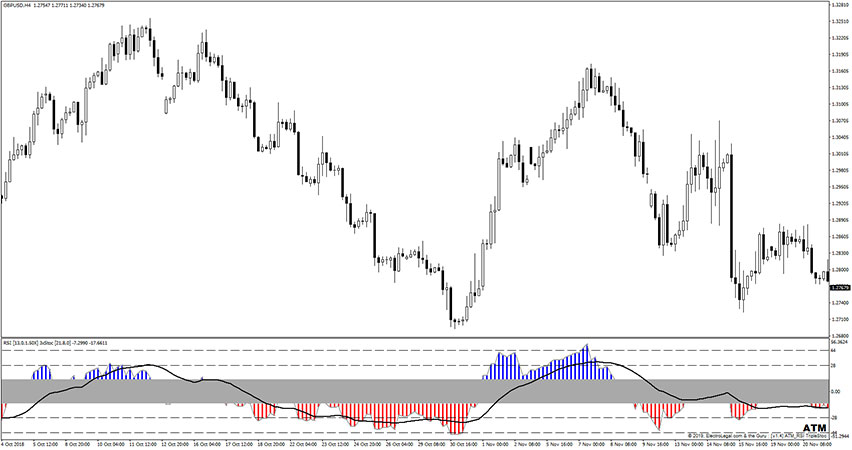
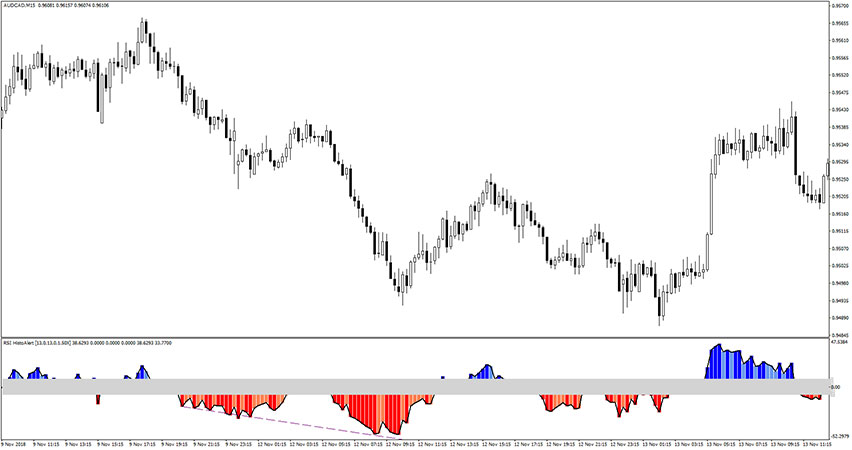
Introduction to the RSI Triple Stochastic Divergence Indicator The RSI Triple Stochastic Divergence indicator is a marvelous buy/sell signals indicator that is based on the Relative Strenght Index (RSI) and a custom Triple Stochastic technical indicator. The values provided by that gauge fluctuates between two extreme values: 28 and -28. There is a special gray…
Tag: rsi indicators
RSI Divergence Indicator
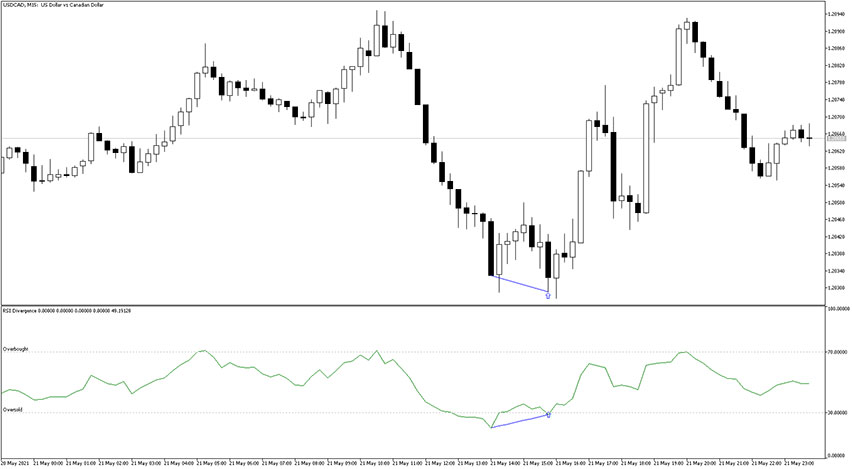
Introduction to the RSI Divergence Indicator The name of the RSI Divergence indicator seeks for Relative Strenght Index divergences and displays them both within indicators window and on the activity chart in conjunction with buy/sell arrows. The indicator is displayed in a separate window placed just below the main trading chart. It fits all kinds…
RSI Color Indicator
Introduction to the RSI Color Indicator The RSI Color indicator is a custom Relative Strength Index indicator. It has an additional feature that colorizes the oscillator line when it hits the overbought/oversold area. You will also find buy/sell arrows which are displayed when the oscillator reaches these levels. It fits all kinds of timeframes and…
RSI Slope Divergence Indicator MTF
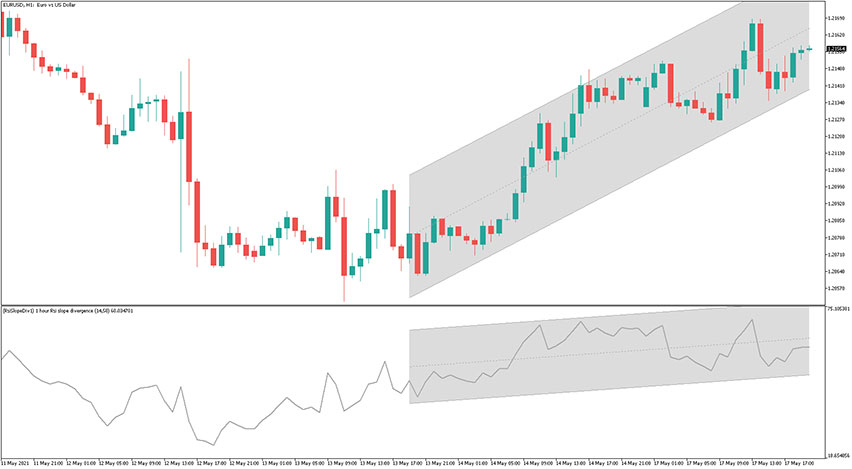
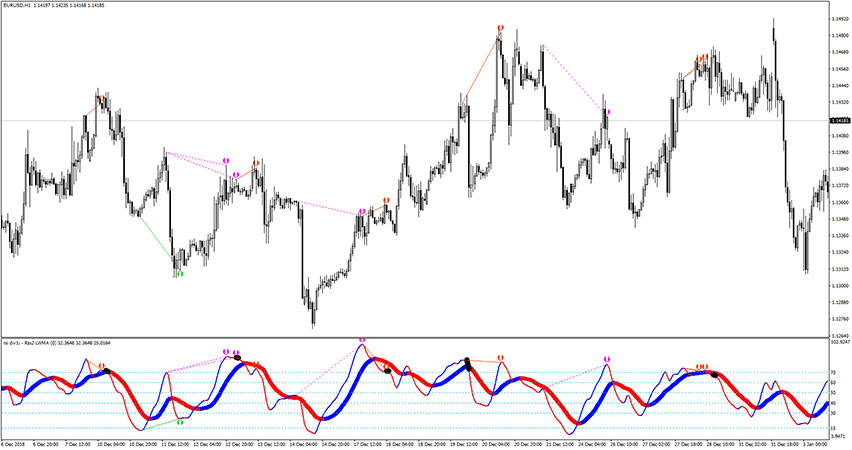
Introduction to the RSI Slope Divergence Indicator MTF The RSI Slope Divergence indicator MTF plots two linear regression channels: directly on the price and on the Relative Strength Index (RSI). It is a multi-timeframe indicator. The general usage of that gauge is divergences detection, but also correction or retracement even before it occurs. The indicator…
RSI Divergence Alert Indicator
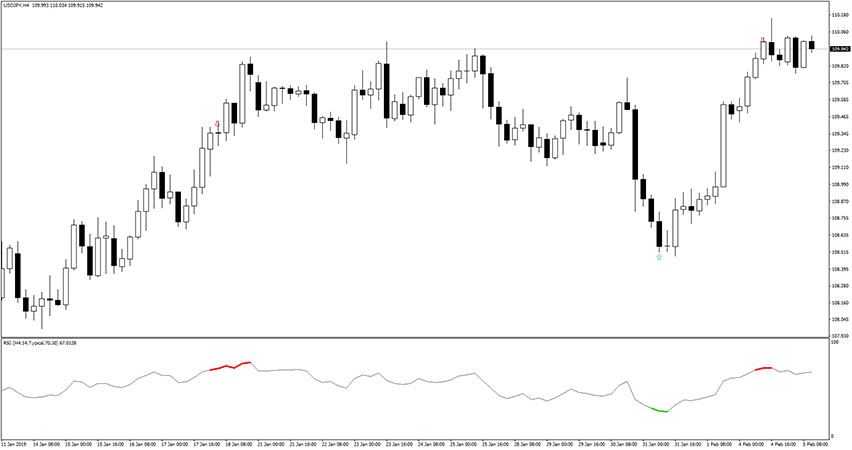
Introduction to the RSI Divergence Alert Indicator The RSI Divergence Alert indicator is a custom variation of the Relative Strength Index indicator that provides alerts when buy/sell signals occur. It fits all kinds of timeframes and currency pairs. The indicator is displayed in a separate window placed just below the main trading chart. The default…
RSIMA Baseline Divergence Arrows Indicator
Introduction to the RSIMA Baseline Divergence Arrows Indicator The RSIMA Baseline Divergence Arrows indicator works great at filtering those divergence signals. Divergences are only visible on this indicator if: If RSI MA is outside 80 Overbought, Bearish Divergence signal will appear (to forecast a reversal to the downside); If RSI MA is outside 20 Oversold,…
RSI with Fibonacci Auto Channel Indicator
Introduction to the RSI with Fibonacci Auto Channel Indicator The RSI with Fibonacci Auto Channel indicator is based on the Relative Strength Index with some Fibonacci levels implemented into the code of this tool. The main bold signal line is colored pink and green and it switches its coloring depending on market trends. You should…
MFI RSI Divergence Indicator
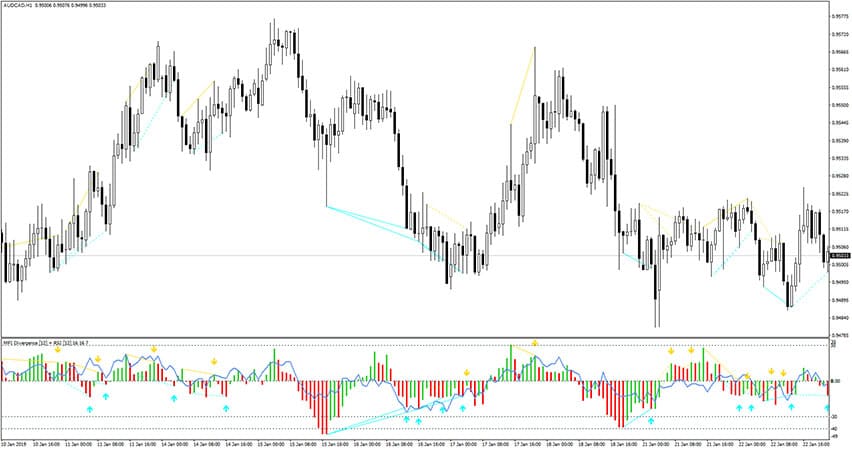
Introduction to the MFI RSI Divergence Indicator The MFI RSI Divergence indicator is a forex tool based on Money Flow Index and Relative Strenght Index. It recognizes, spots, and displays divergence. Additionally, it provides buy/sell arrows for bullish and bearish divergences. We suggest using it for entries and exit ideas or as a filter in…
Dynamic Zone RSI Indicator
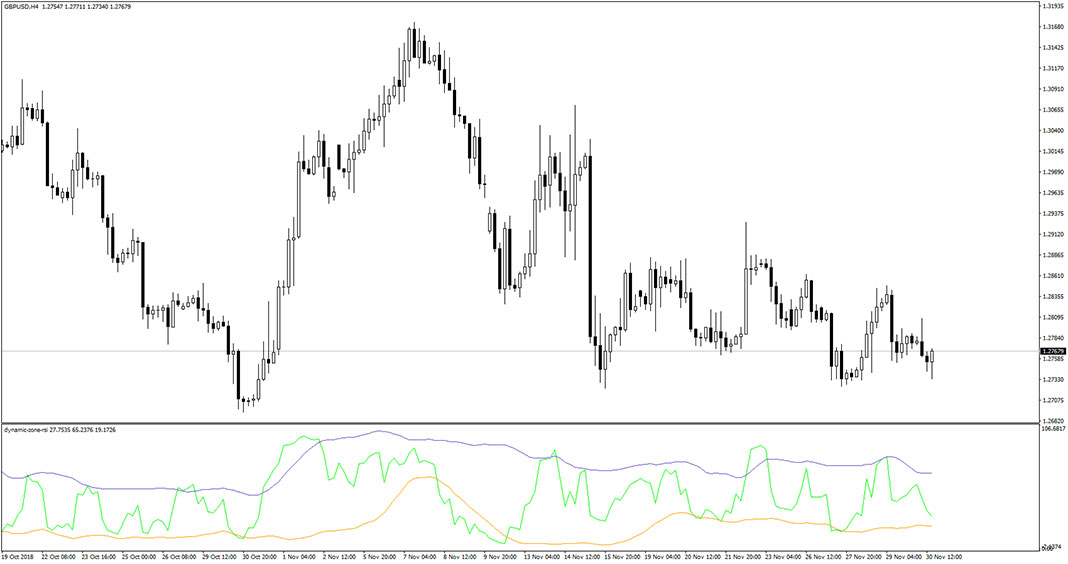
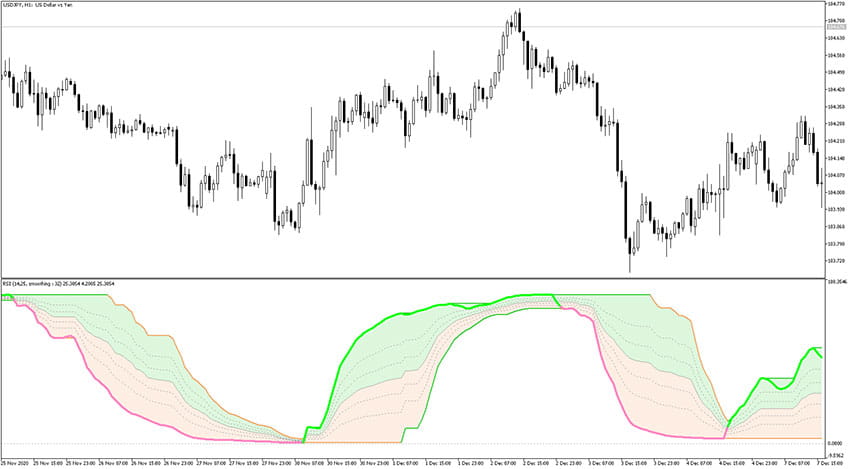
Introduction to the Dynamic Zone RSI Indicator The Dynamic Zone RSI Indicator is a forex technical analysis tool that combines RSI and two floating bands. The indicator is displayed in a separate window placed just below the main trading chart. The bands act in a similar manner to support and resistance. The purple band acts…
Adaptive Relative Strength Index Smoothed Indicator
Introduction to the Adaptive Relative Strength Index Smoothed Indicator The Adaptive Relative Strength Index Smoothed is a popular trend-following forex indicator. It uses a set of moving averages based on RSI and plots a trend cloud near the price bars directly on the main chart window. Usually, when price holds its position above the cloud…