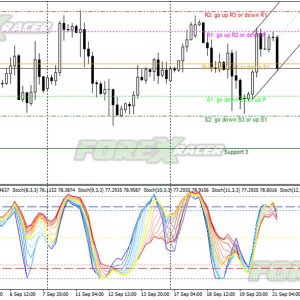
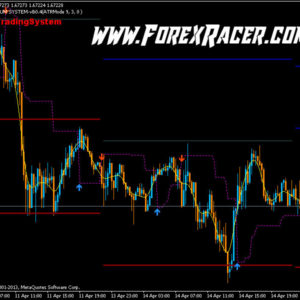
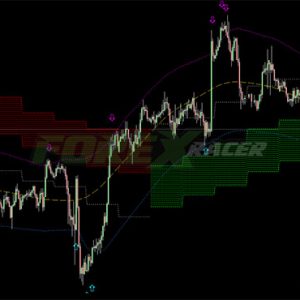
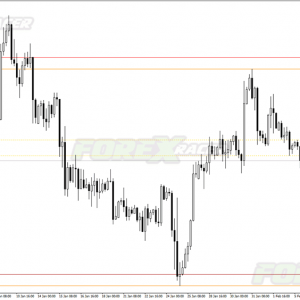
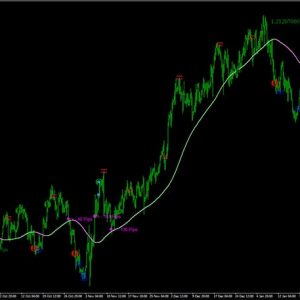
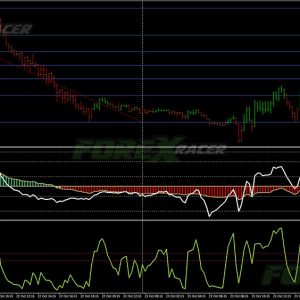
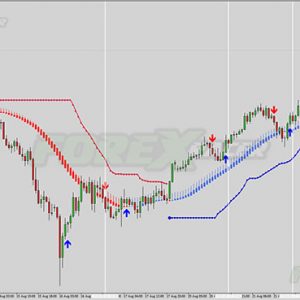
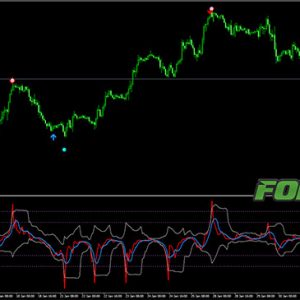
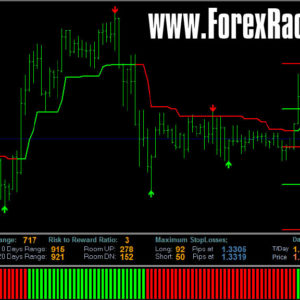
The Xard Chart 2016 is an intraday forex strategy. The styles of trading with this system can be described as trend momentum, reversal and support and resistance. You should trade it on 5 min and 15 min timeframe and your favourite currency pairs.
This system works on Metatrader 4 and include following indicators:
MA4X-Bid Ratio V.1.6,
MT4X-Math,
MT4X-Round Numbers,
MT4X Sessions,
MT4 Xard trading line,
MT4X Support and Resistance,
MT4X Stochastic.
How to trade with Xard Chart trading system?
Open BUY order when following conditions are met:
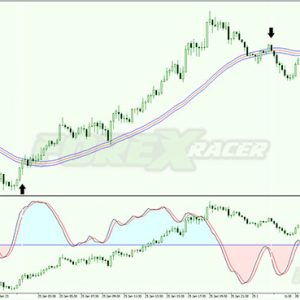
- Arrow buy is displayed (blue arrow pointing up)
- Stochastic crosses upward ( line cyan color)
- Xard trading line blue color with green cloud
Open SELL order when following conditions are met:
- Arrow buy is displayed (orange arrow pointing down)
- Stochastic crosses downward ( line yellow color)
- Xard trading line red color with red cloud
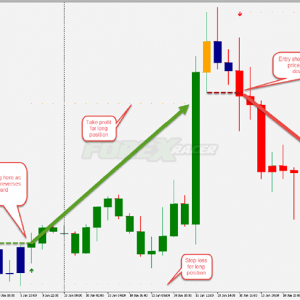
Take profit and stop loss suggestions:
- The SR lines and Murrey Math are possible profit target.
- Place initial stop loss at the last swing high/low.

