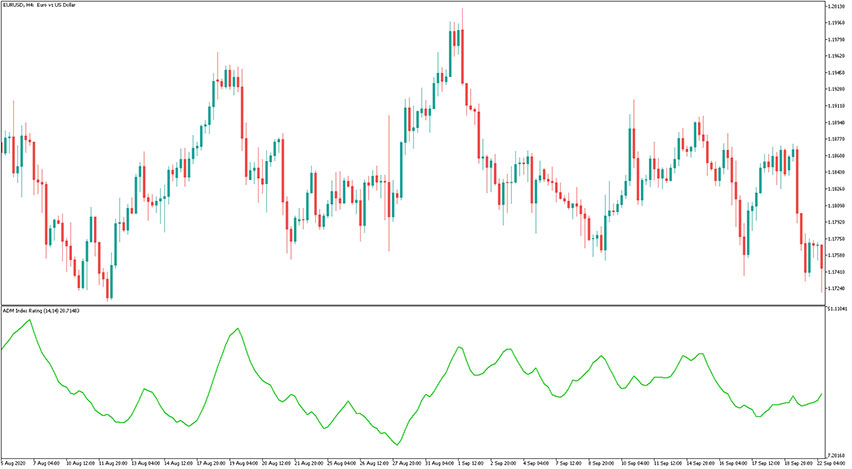
Introduction to the ADMIR Indicator The ADMIR indicator is a forex oscillator, that name means Average Directional Movement Index Rating. It reveals the ratio of the ADX lines of two indicators, Average Directional Movement Index along with the calculation periods conflicting by the listed value. The indicator is displayed in a separate window placed just…
Category: Forex MT5 Indicators
Percent Difference Oscillator Indicator
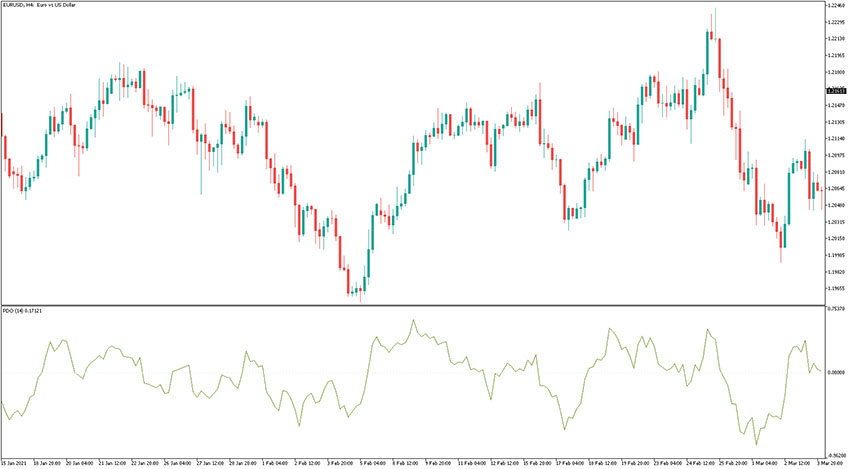
Introduction to the Percent Difference Oscillator Indicator The Percent Difference Oscillator (PDO) indicator is, as the name suggests, an oscillator that shows the difference between the moving average and the current close price. Results are provided as the percent of the moving average (above or below the MA). The formula for the Percent Difference Oscillator…
RSI Divergence Candles Indicator
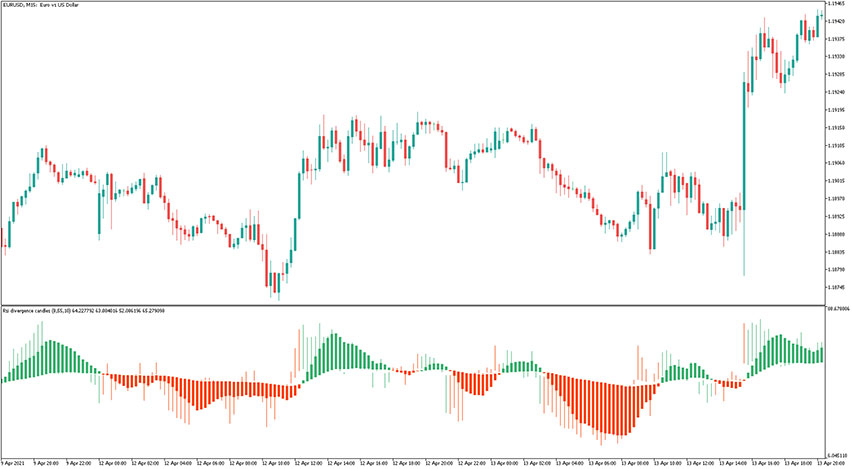
Introduction to the RSI Divergence Candles Indicator The RSI Divergence Candles indicator is a momentum oscillator that measures the speed and change of price movements. The indicator is displayed in a separate window placed just below the main trading chart. The signals are shown in the form of candles that are colored differently in a…
Trend Strength Indicator
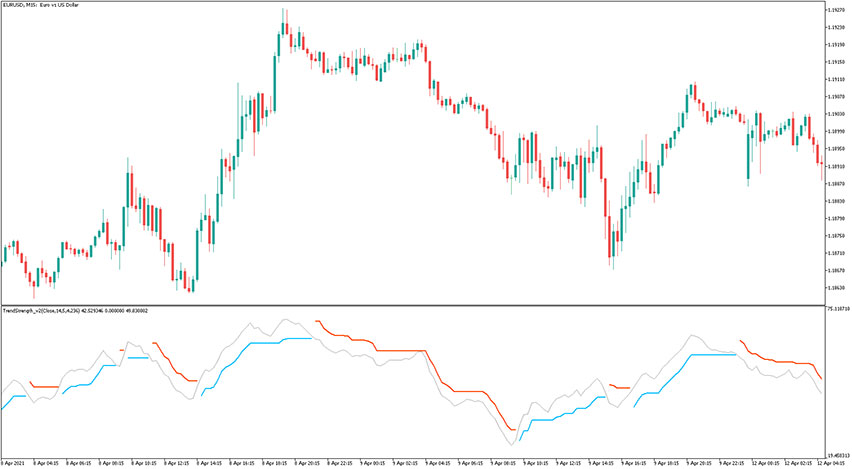
Introduction to the Trend Strength Indicator The Trend Strength indicator uses custom calculations based on the Relative Strength Index to determine the direction of the trend. The indicator is displayed in a separate window placed just below the main trading chart. You will find three lines: gray Smoothed RSI, blue UpTrend line, and red DnTrend…
Automatic Trendline Indicator
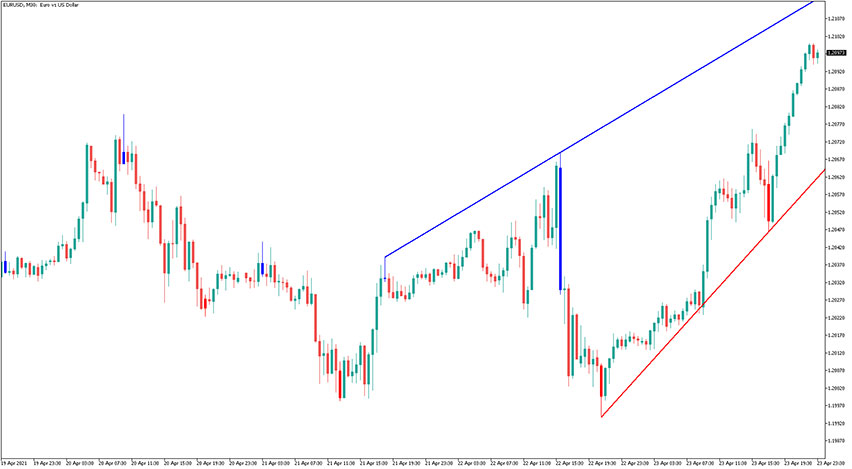
Introduction to the Automatic Trendline Indicator The Automatic Trendline indicator, as the name suggests, draws trendlines on the chart automatically. This indicator has six inputs. Users can specify alternative labels for both lines. If multiple instances of the indicator are used, the labels must differ. One can set the width and color of the lines…
Precision Trend Indicator
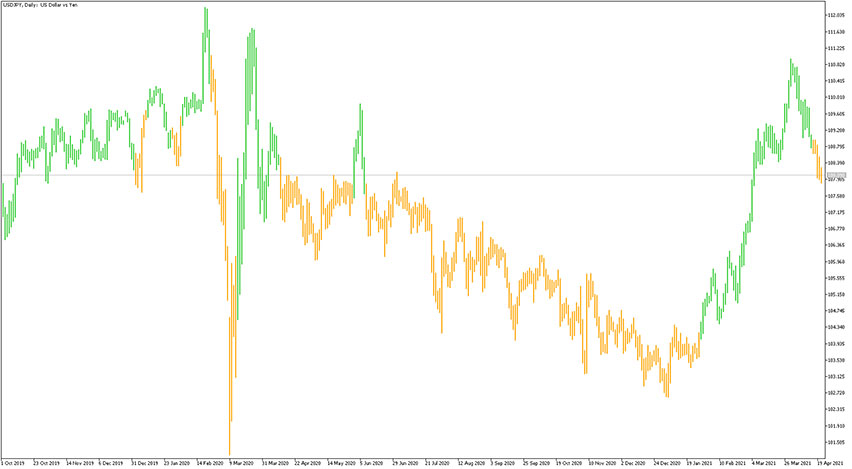
Introduction to the Precision Trend Indicator The Precision Trend indicator recognizes the trend direction and overlaps default candles to according colors (lime/orange). The signals provided by that tool are really easy to read – you can use it for standalone scalping, swing trading, and reversals. It is a NON REPAINT indicator, so you can backtest…
ADX VMA Trend Indicator
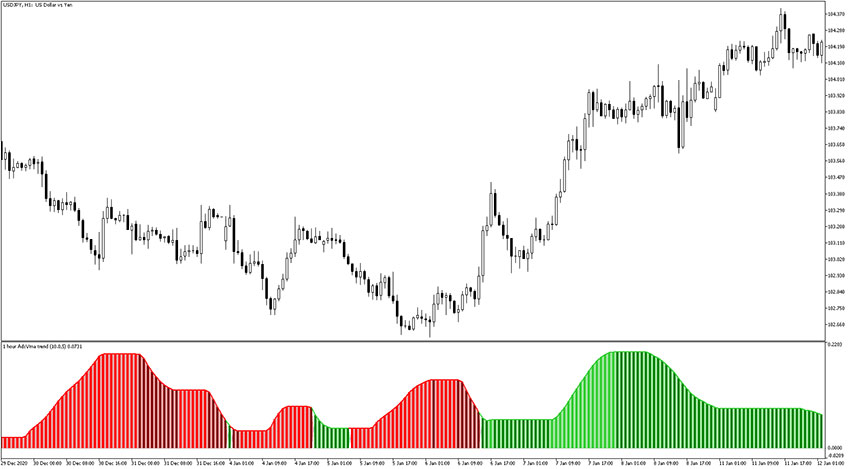
Introduction to the ADX VMA Trend Indicator The ADX VMA Trend indicator uses adxvma steps to show the trend and its strength. The values can be smoothed using one of the 5 smoothing types: simple moving average exponential moving average smoothed moving average linear weighted moving average adxvma average Red bars reflect a bearish trend…
RSI with Fibonacci Auto Channel Indicator
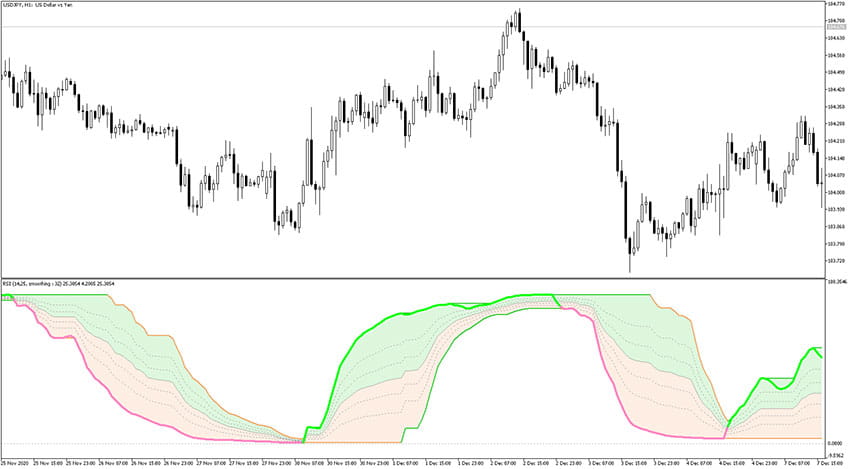
Introduction to the RSI with Fibonacci Auto Channel Indicator The RSI with Fibonacci Auto Channel indicator is based on the Relative Strength Index with some Fibonacci levels implemented into the code of this tool. The main bold signal line is colored pink and green and it switches its coloring depending on market trends. You should…
Currency Strength Meter Indicator
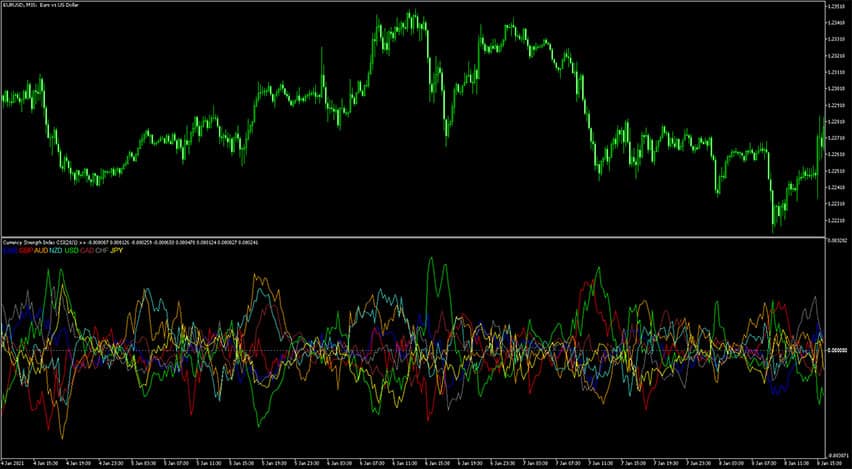
Introduction to the Currency Strength Meter Indicator The Currency Strength Meter indicator shows which currencies are trading STRONG against the WEAK currencies! The indicator is displayed in a separate window placed just below the main trading chart, and it provides the strength momentum of the 8 major currencies: EUR GBP AUD NZD CAD CHF JPY…
Support and Resistance Indicator
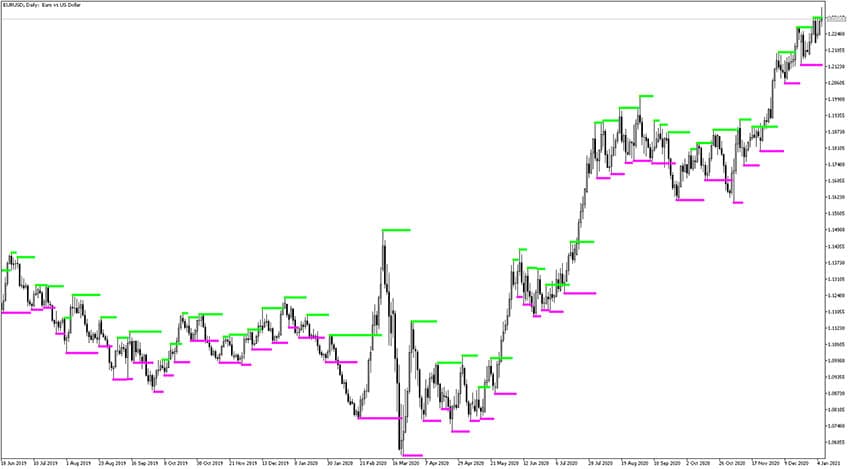
Introduction to the Support and Resistance Indicator The Support and Resistance indicator for MT5 displays the support and resistance levels using the Fractals indicator. The calculation of support levels is based on the “Fractals down”, and the calculation of the resistance levels is based on the “Fractals up” of the Fractals indicator by Bill Williams.…