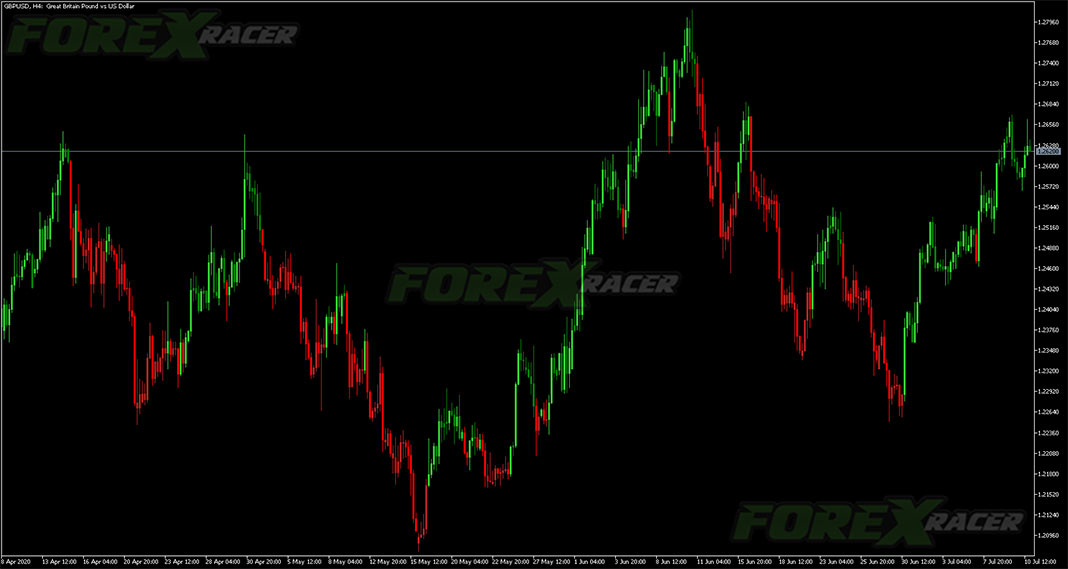
The MACD Color Candles Indicator displays color candles corresponding to MACD bullish (green candles) / bearish (red candles) market conditions. How to set up the MACD Color Candles indicator in MT5? Installation Guide Download the MACD Color Candles.rar archive at the bottom of this post, unpack it, then copy and paste the MACD Color Candles.ex5…
Category: Forex MT5 Indicators
Instantaneous Trend Line Levels Indicator
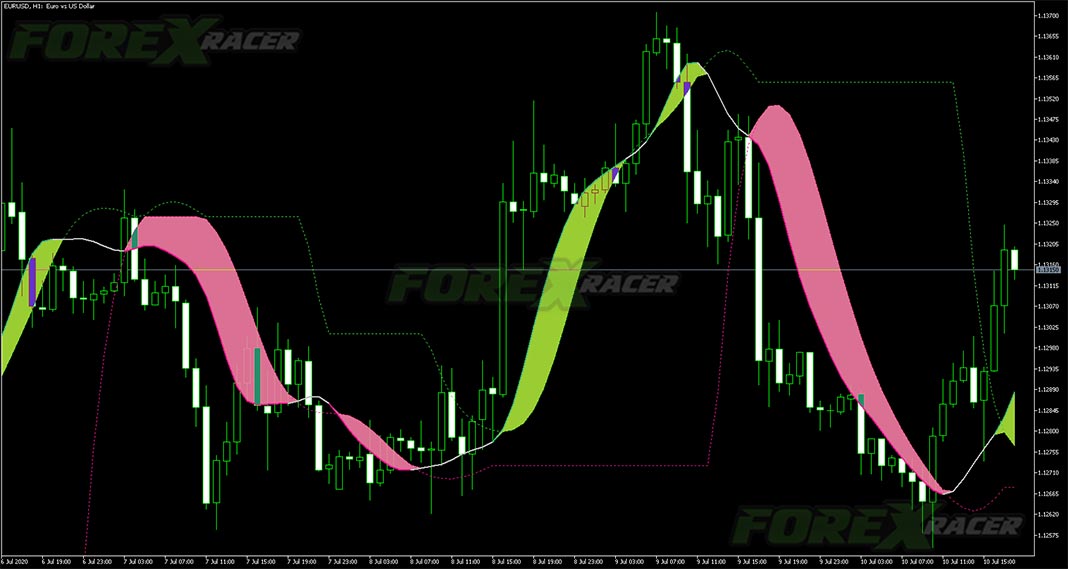
There are several versions of the Instantaneous Trend Line Levels forex indicator but their usage is what differentiates one edition from the other. The Instantaneous Trend Line Levels Indicator is dedicated to Metatrader 5 (MT5) trading platform. Some versions of the indicator rely on the ITL slope for signals, but they generate way too many…
Trend Confirmation Index Indicator for MT5
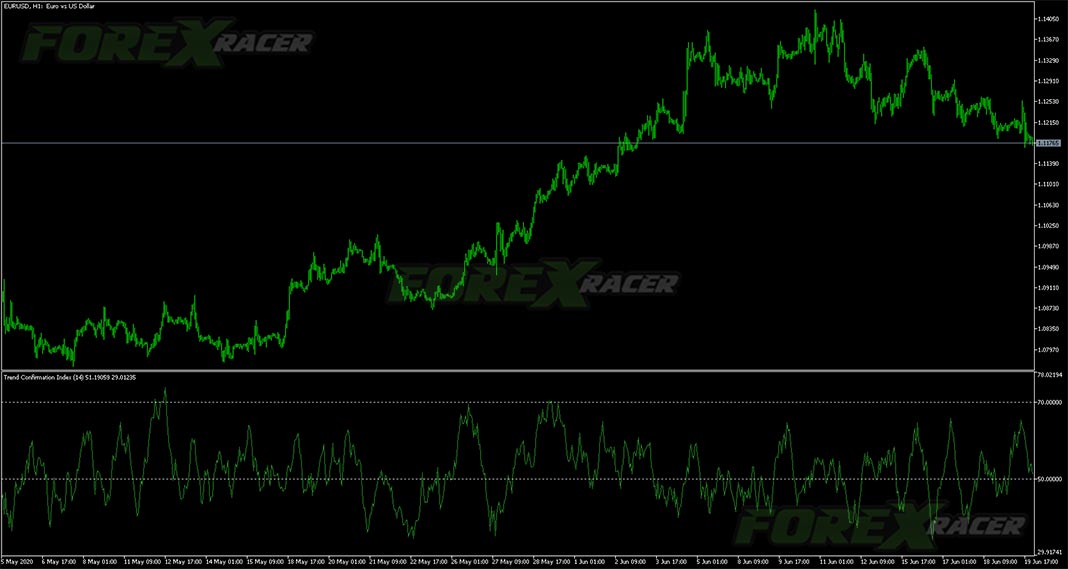
The Trend Confirmation Index is a forex technical indicator for Metatrader 5 that is able to calculate the current condition of the market. Traders can also evaluate the overbought (>70) and oversold (<30) market levels when using the Trend Confirmation Index MT5 forex indicator. Assuming the close price contained within the candlesticks provides the information…
Schaff Trend Cycle Adjustable Smoothing MT5
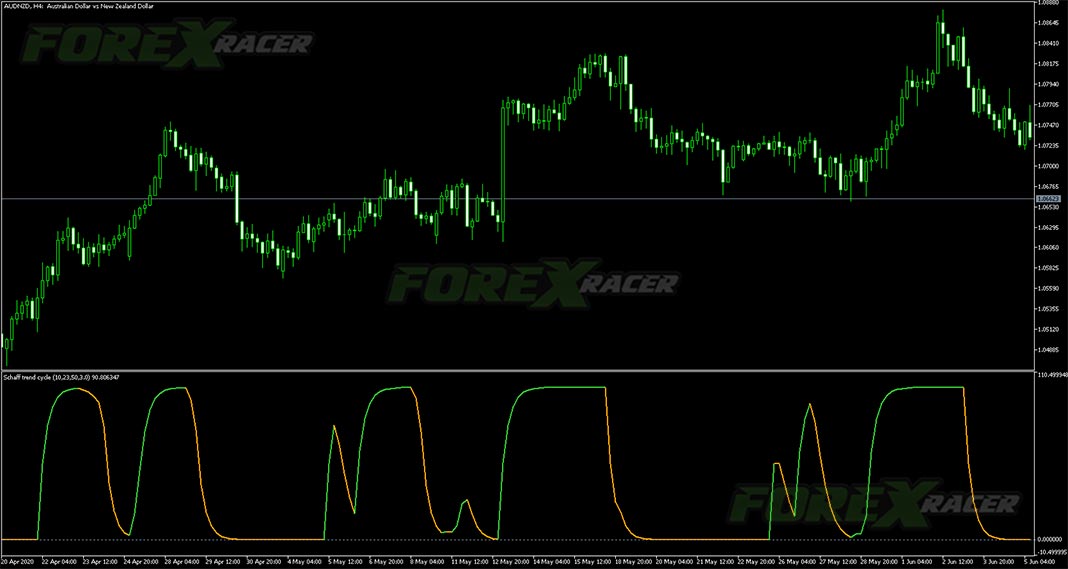
The Schaff Trend Cycle Adjustable Smoothing Indicator for MT5 is a classic trading tool that helps you analyze and determine the direction of the market trend using a simple color-changing curve displayed in the separate window placed below your main trading chart. When the price goes upward, you are supposed to see a green color…
SSD with Histogram Indicator
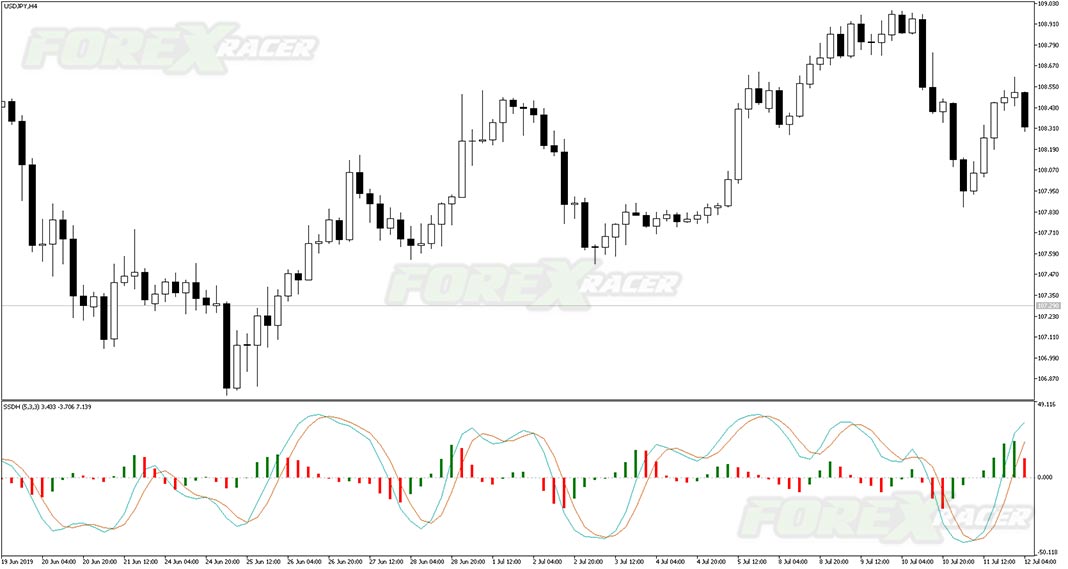
The SSD With Histogram is a custom forex indicator for Metatrader 5 (MT5) that shows a slow stochastic line, a signal line, and a histogram that reflects the difference between the slow line and the signal line. The indicator and its elements are displayed in a separate window just below your main trading chart. The…
Double RSI Trading Signals MT5 Indicator
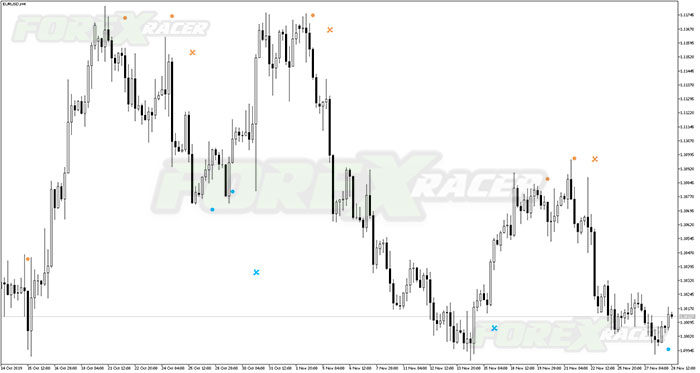
We often refer to the double RSI trading signals indicator for Metatrader 5 as “RSI with RSI”. Two different RSI periods generate both entry and exit signals on any financial instrument. The indicator is expressed by orange and blue dots. The two dots are positioned above or below the candlesticks, as you can see on…
Vortex Trend Indicator
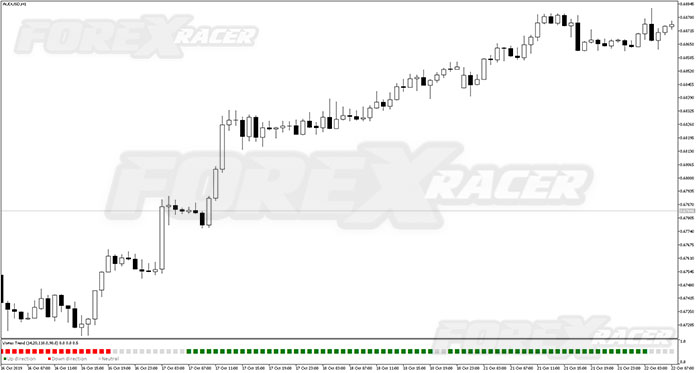
Introduction to the Vortex Trend Indicator The Vortex Trend Indicator is a simple trend recognition tool. It’s based on the original Vortex indicator, but it has some modifications. The indicator shows a colorised diagram, to highlight the trend direction. The green color represents a bullish trend, whereas, the red color signals a bearish trend and…