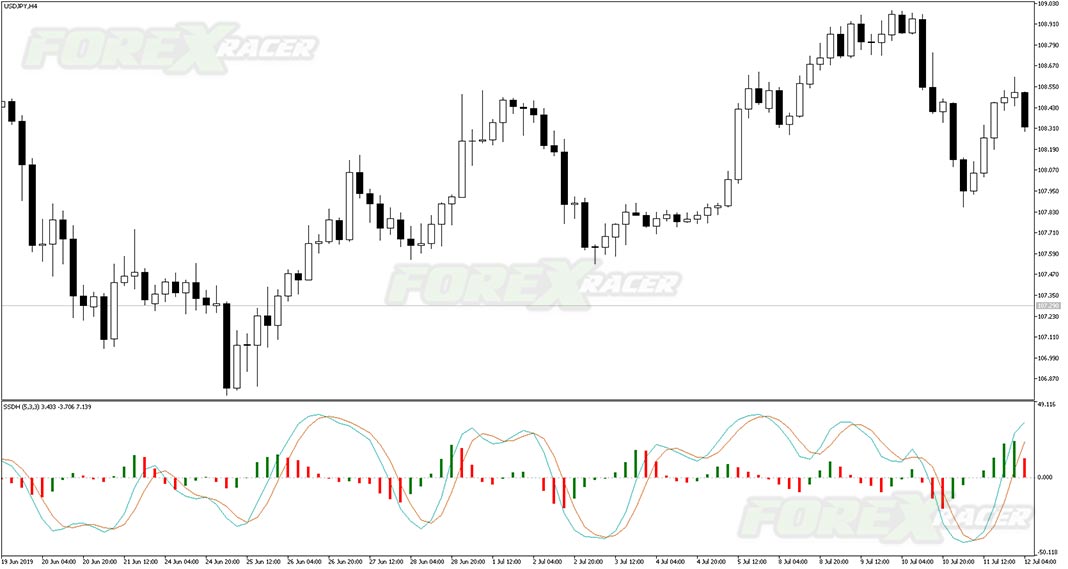
The SSD With Histogram is a custom forex indicator for Metatrader 5 (MT5) that shows a slow stochastic line, a signal line, and a histogram that reflects the difference between the slow line and the signal line. The indicator and its elements are displayed in a separate window just below your main trading chart.
The slow stochastic line is shown as the light sea green line within the indicator window, while the brown colored line represents the signal line. The histogram is made of red and blue bars that take negative or positive values (above or below 0 level).
These are the calculations that determine the core of SSD_With_Histogram MT5 forex indicator:
K = Stochastic D – 50.0
D = SMA(K, %D Period)
Histogram = K – D
The indicator performs the computation as needed and it’s therefore needless to bother ourselves about the different formula.
How does SSD with Histogram indicator work?
When the histogram take values above the zero level, the market is considered to be bullish.
Green histogram above zero level is a sign of a strong bullish trend, when red histogram above the zero occurs it means there is a pullback within the bullish trend.
When the histograms take values below the zero level, the market is considered to be bearish.
Red histogram below the zero level is a sign of a strong bearish trend, when green histograms below the zero occurs it means there is a pullback within the bearish trend.
The stochastics and signal line crossover provides us great potential for trading opportunities.
How to install the SSD with Histogram Indicator on your Metatrader 5 trading plaftform?
- Download the indicator by clicking “LINK” button at the bottom of this post.
- Copy and paste the SSD with Histogram Indicator files into following folder of your Metatrader 5 (MT4) platform: MQL5 > Indicators.
- You can gain access to the folders this way: File > Open Data Folder > MQL5 > Indicators (paste files here).
- Restart your Metatrader 4 Client.
- Select Chart and Timeframe where you want to test the indicator
- Browse “Custom Indicators” in your Navigator that is located on the left in your Metatrader 4 platform.
- Right click on ssd-with-histogram-indicator.mq5 and than click “Attach to the chart”.
- You can modify settings if you need and than click ok.
- The indicator is ready and running on the chart.
In the archives you will find following Metatrader 5 files included:
- ssd-with-histogram-indicator.mq5
SSD with Histogram Indicator Free Download
To download the SSD with Histogram Indicator for Metatrader 5 (MT5) for free just click the button below:
SSD with Histogram Indicator Free Download


 Indicator")

