Introduction to the QQE Histogram Indicator
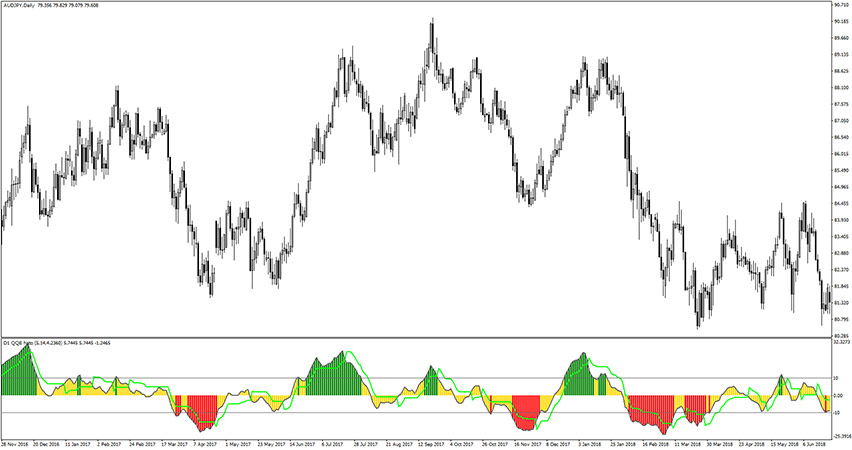
The QQE Histogram Indicator is another variation of the original QQE indicator, which was only used to show the QQE values. The QQE Histogram indicator, as the name suggests, shows signals in the form of a histogram, demonstrating a clear momentum overview and overbought/oversold levels.
The QQE Histogram Indicator fits all kinds of timeframes and currency pairs. It is displayed in a separate window placed just below the main trading chart. The default settings can be modified directly from the input tab. Feel free to experiment with the settings and parameters to fit your personal preferences.
How does it work? How to apply in trading?
Trading Rules Explanation
The QQE Histogram Indicator is very helpful for swing traders as it is known for identifying the price swing areas accurately, even during choppy, sideways or highly volatile market conditions. It uses the 10 and -10 levels to define the overbought/oversold states. That histogram bars are green, yellow, and red color. Additionally, QQE Histogram Indicator includes a 14-period RSI (green line) that offers a double confirmation for potential market reversals.
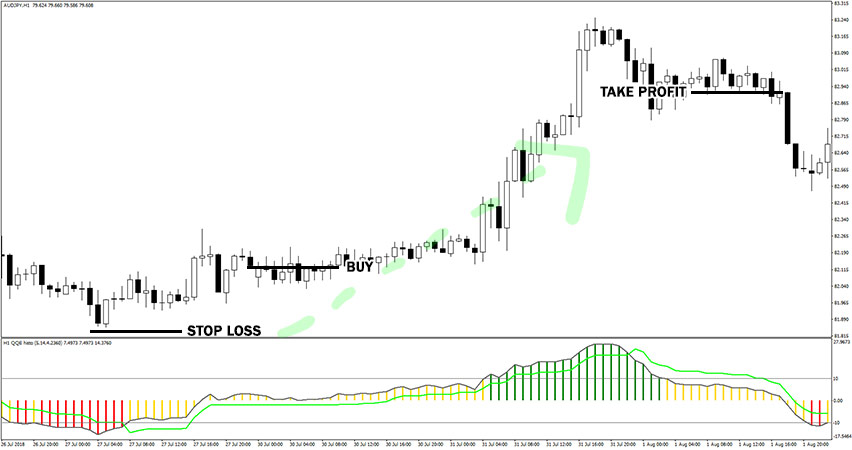
Buy Signal
Follow these steps for a long trade:
- The QQE Histogram rises above the 0 level
- The RSI shows positive value
- Price swings higher from recent low swing
- Buy trade is triggered after the above conditions are met
- Set stop loss a few pips below the last swing low of the market
- Take profit or exit trade when QQE Histogram drops below 10 level, or use your own method of trade exit
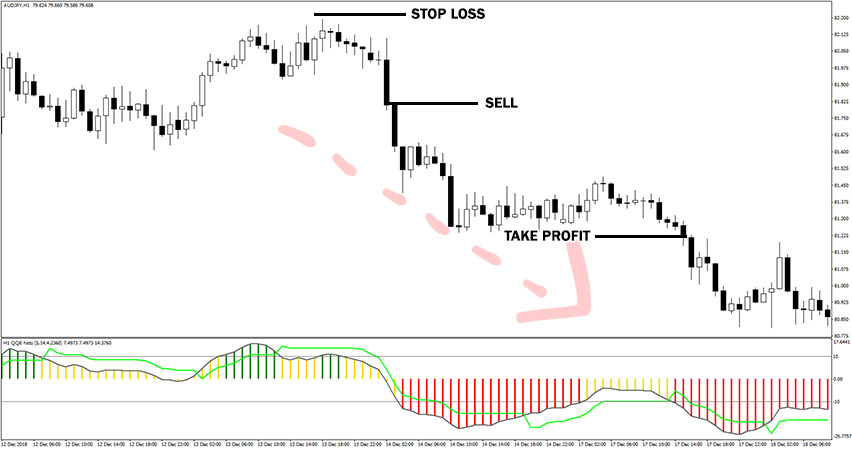
Sell Signal
Follow these steps for a short trade:
- The QQE Histogram drops below the 0 level
- The RSI shows negative value
- Price swings lower from recent high swing
- Sell trade is triggered after the above conditions are met
- Set stop loss a few pips above the last swing high of the market
- Take profit or exit trade when QQE Histogram rise above -10 level, or use your own method of trade exit
As always, to achieve good results, remember about proper money management. To be a profitable trader you need to master discipline, emotions, and psychology. It is crucial to know when to trade, but also when not to trade. Avoid trading during unfavorable times and market conditions like low volume/volatility conditions, beyond major sessions, exotic currency pairs, wider spread, etc.
How to set up the QQE Histogram indicator in MT4?
Installation Guide
Download the QQE Histogram.rar archive at the bottom of this post, unpack it, then copy and paste the QQE Histogram.ex4 or QQE Histogram.mq4 indicator files into the MQL4 folder of the Metatrader 4 trading platform.
You can gain access to this folder by clicking the top menu options, which goes as follows:
File > Open Data Folder > MQL4 > Indicators (paste here).
Now go to the left side of your MT4 terminal. In the Navigator find the gauge name, right-click it and select Attach to the chart.
Bottom Line
The QQE Histogram indicator is well worth adding to your trading collection. A good forex indicator will most probably enhance your chance of success. Nonetheless, remember about having realistic expectations. Just like any other technical analysis tool, is not capable of providing accurate signals 100% of the time. Thus, this forex indicator provides false signals occasionally. Its performance will vary significantly depending on market conditions. Feel free to develop your own trading system based around it.
Download Free Forex MT4 QQE Histogram Indicator
To download the QQE Histogram Indicator for Metatrader 4 (MT4) for free just click the button below:
QQE Histogram Indicator Free Download


