
Introduction to the Standard Deviation Channels X3 Cloud Indicator The name of the Standard Deviation Channels X3 Cloud Indicator pretty much defines what it is. It plots a channel (with three extensions to top and bottom) based on the Standard Deviation indicator. The violet trendline is a middle line of the channel. First, check the…
Category: Forex MT5 Indicators
Wajdyss Ichimoku Candle Alert Indicator

Introduction to the Wajdyss Ichimoku Candle Alert Indicator The Wajdyss Ichimoku Candle Alert Indicator uses Ichimoku Kinko Hyo to calculate its values. That indicator colorize candlesticks according to the trend-momentum – the blueish candles indicate bullish market momentum, and the redish candles reflect bearish market momentum. The Wajdyss Ichimoku Candle Alert Indicator fits all kinds…
RSI of Adaptive Moving Average Indicator

Introduction to the RSI of Adaptive Moving Average Indicator The RSI of Adaptive Moving Average Indicator is, as the name suggests, a combination of Relative Strenght Index and Moving Average indicator. Simply speaking, it plots a smoothed line that follows price. The signal line is either green or orange. A green line indicates bullish trend-momentum,…
CCI Hull Indicator
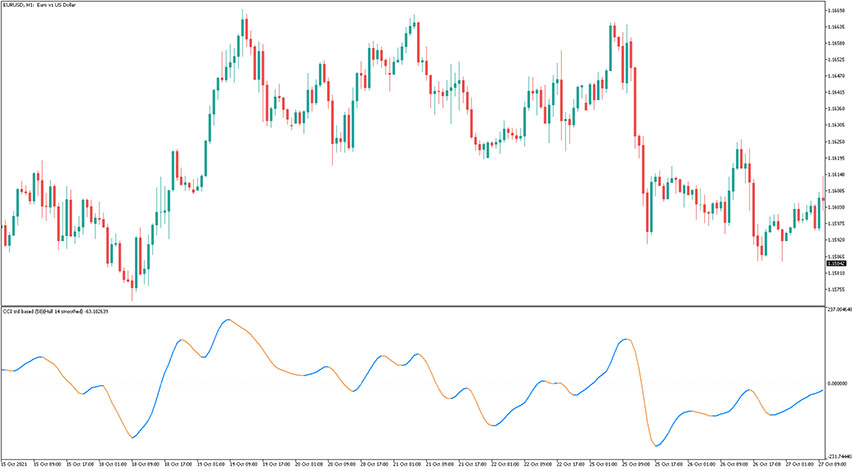
Introduction to the CCI Hull Indicator The CCI Hull Indicator is, as the name suggests, a combination of Commodity Channel Index and Hull indicator. The Hull period is set to 14, and the CCI period is set to 50. As you can see, the signal line is either blue or orange. A blue line indicates…
Channel on Parabolic Indicator

Introduction to the Channel on Parabolic Indicator The Channel on Parabolic Indicator combines a price channel and Parabolic Sar indicator into one trading tool. Granted that the price constantly moves within channel bands, a trader should look for buy trade opportunities when the price hits red bands and the entry is confirmed with Parabolic Sar…
Forex Off Trend Indicator

Introduction to the Forex Off Trend Indicator The Forex Off Trend Indicator is a trend-following tool and its signals are presented in a form of the cloud. When the cloud is green, the trend momentum is considered to be bullish and traders should take buy opportunities. Conversely, when the cloud is pink, the trend momentum…
MACD 2 Line Indicator

Introduction to the MACD 2 Line Indicator The MACD 2 Line Indicator is obviously based on the Moving Average Convergence Divergence indicator but it has 2 lines that form a cloud. The difference between the MACD and the signal line is presented in the form of a color histogram. The MACD 2 Line Indicator fits…
3X Parabolic Regression Indicator

Introduction to the 3X Parabolic Regression Indicator The 3X Parabolic Regression Indicator draws two linear trend channels calculated on the standard deviation (with different periods) and a single curvilinear trend channel calculated on a parabolic regression. The 3X Parabolic Regression Indicator fits all kinds of timeframes and currency pairs. It is displayed directly on the…
Supertrend Indicator

Introduction to the Supertrend Indicator The Supertrend Indicator is a high-demand forex trading tool. It helps to solve major issues, like what is the current trend, when does it start and end. Signals provided by that Supertrend gauge give answers to these questions. Both beginners and advanced forex traders find it powerful and highly accurate.…
Adaptive Renko CLD Indicator

Introduction to the Adaptive Renko CLD Indicator The Adaptive Renko CLD Indicator is a forex trend-following indicator using the Renko indicator included in its formula. It consists of two elements: an upward/downward band and a cloud. It does a really good job at recognizing trend-momentum, and obviously, it works best during strong market swings. The…