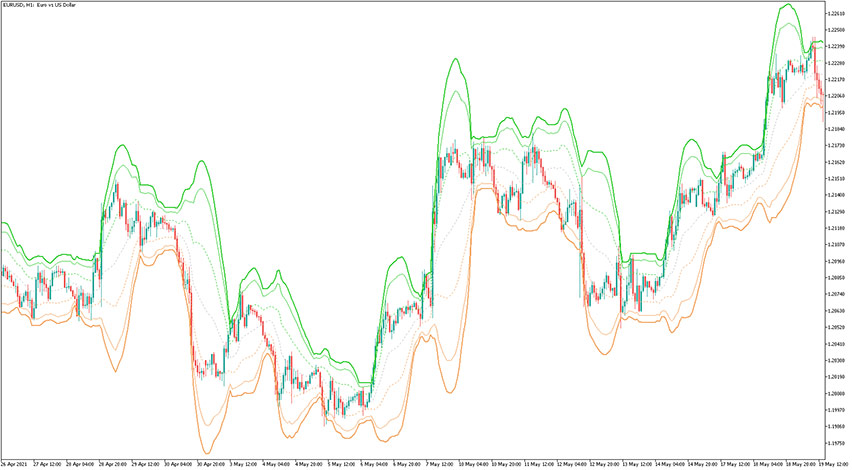
Introduction to the VWAP Bands Indicator The VWAP Bands Indicator is similar to the Bollinger Bands, but to calculate its values it uses Volume-Weighted Average as the central value of the bands. Additionally, you can choose an option to use the tick volume or real volume for calculation (only in the case, if the symbol…
Category: Forex MT5 Indicators
MACD Parabolic SAR Indicator
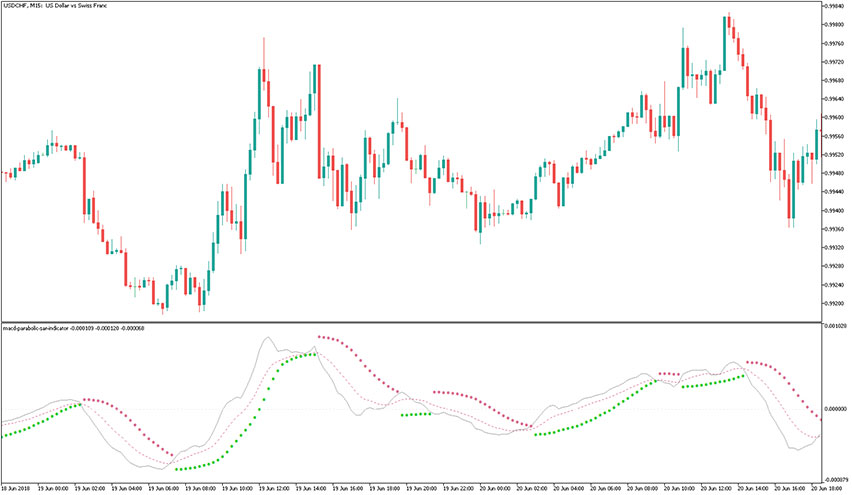
Introduction to the MACD Parabolic SAR Indicator The MACD Parabolic SAR Indicator is, as the name suggests, a combination of Moving Average Convergence Divergence and Parabolic SAR. Both forex indicators are well-known and appreciated by traders around the world. Making a single forex indicator out of these two results in a highly-effective trading tool. The…
MBFX Timing Indicator
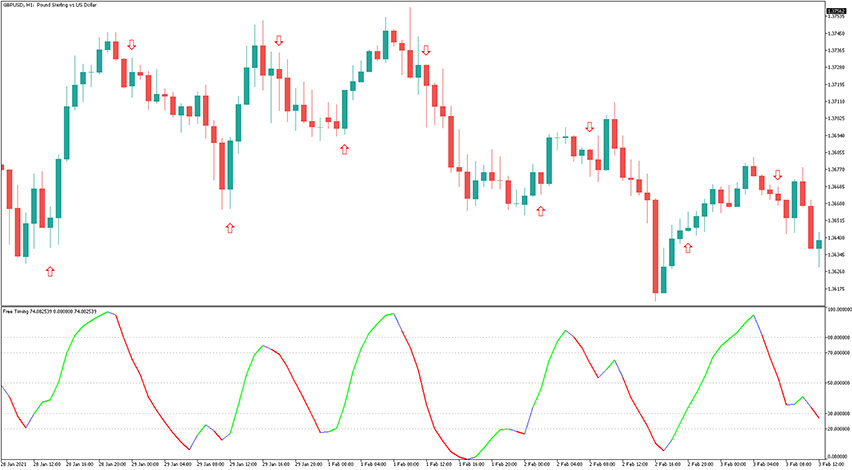
Introduction to the MBFX Timing Indicator The MBFX Timing Indicator is a forex oscillator providing the best time to enter and exit the market. The indicator was originally developed by Mustapha BELKHAYATE. The MBFX Timing is best used to identify price extremes and then time the potential turning points. The way it works is similar…
Chartmill Value Indicator
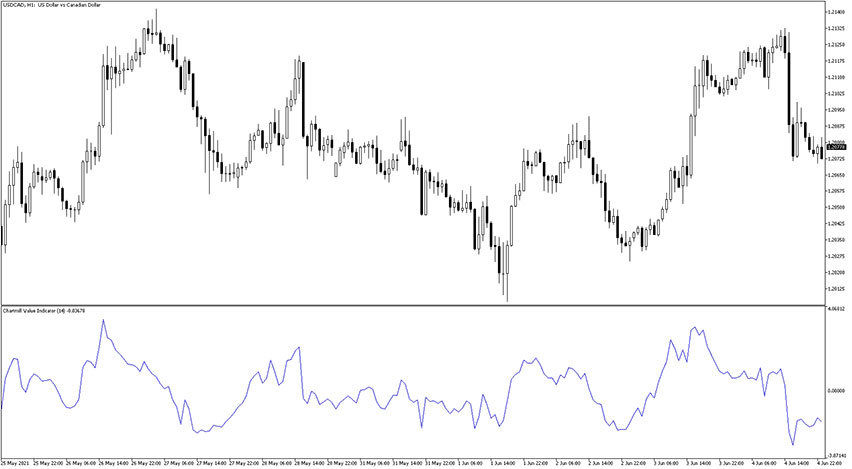
Introduction to the Chartmill Value Indicator The Chartmill Value indicator is a custom forex technical analysis tool, that was developed by Dirk Vandycke and first introduced in the Technical Analysis of Stocks & Commodities magazine in January, 2013. The Chartmill Value indicator portrays a standard deviation from the moving average indicator and has the potential…
SRange Contraction Indicator
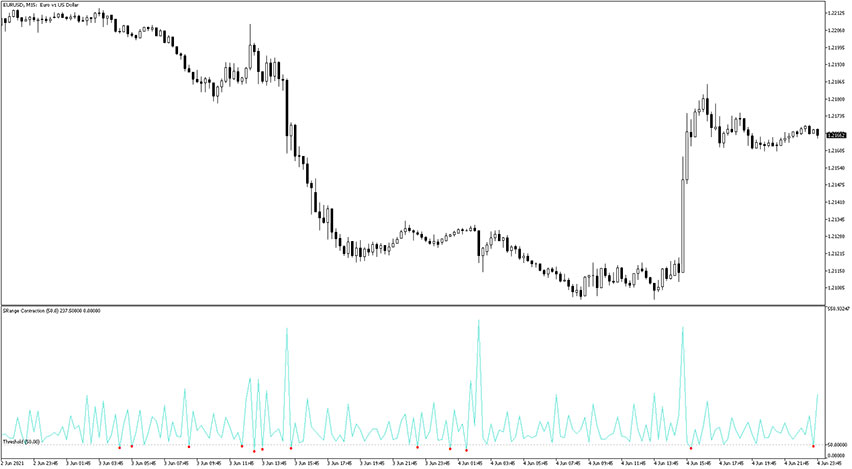
Introduction to the SRange Contraction Indicator The name of the SRange Contraction indicator calculates the ratio between today’s and the previous day’s ranges and displays these values. When the previous day’s range is tighter than the day before, this could suggest a potential explosive momentum today according to Toby Crabel. An alert pointer (red dot)…
Intraday Momentum Index Indicator
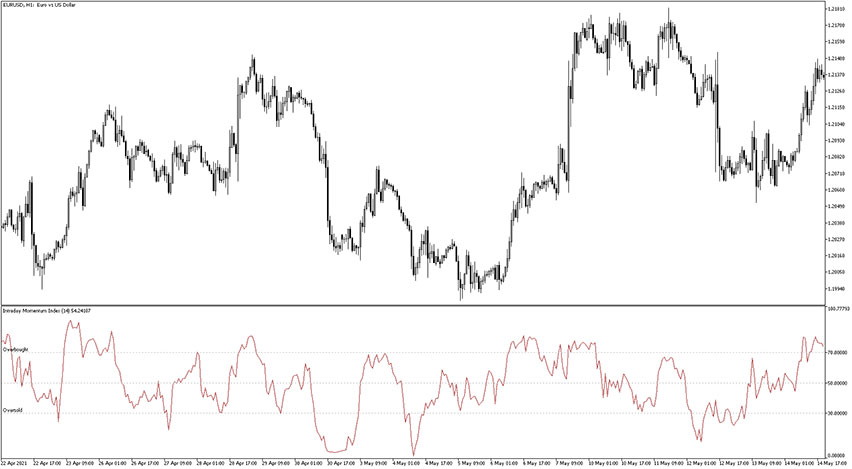
Introduction to the Intraday Momentum Index Indicator The name of the Intraday Momentum Index indicator is an oscillator the measures the ratio between the directed change in price and the total change in the prices over the given period of time. The indicator is displayed in a separate window placed just below the main trading…
Pain Indicator
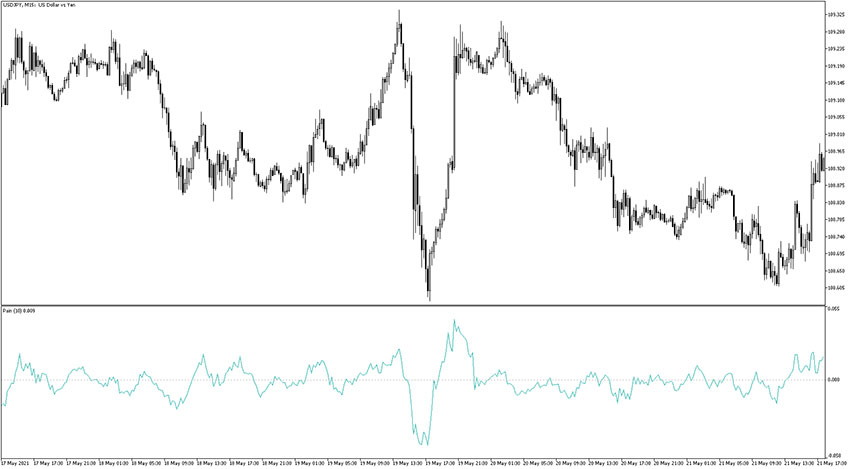
Introduction to the Pain Indicator The name of the Pain indicator is a custom forex indicator that shows the OHL#C candlestick price ratio over a specified time period. This is an oscillator. The indicator is displayed in a separate window placed just below the main trading chart. It fits all kinds of timeframes and currency…
Gann High Low Activator SSL Alert Indicator
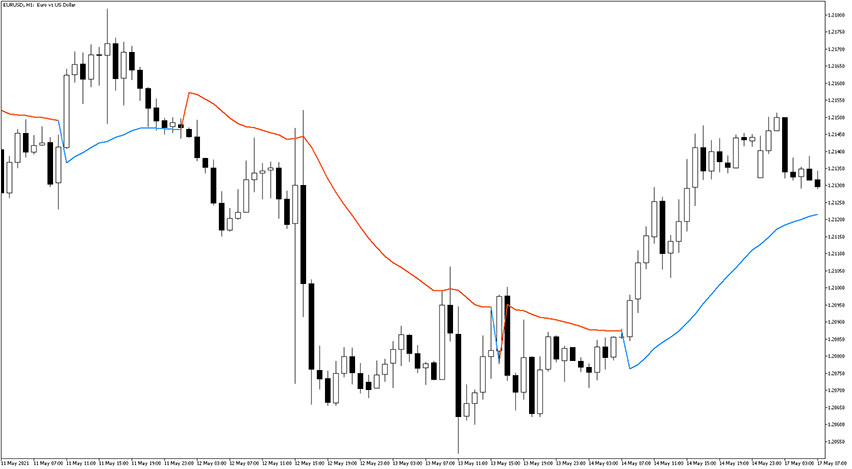
Introduction to the Gann High Low Activator SSL Alert Indicator The Gann High Low Activator SSL Alert indicator is based on the original Gann Hi-Lo Activator SSL, but this one was rewritten in MQL5. Another change is that the original indicator was single color, that is why for the more visual definition of the trend…
Super Trend Hull Indicator
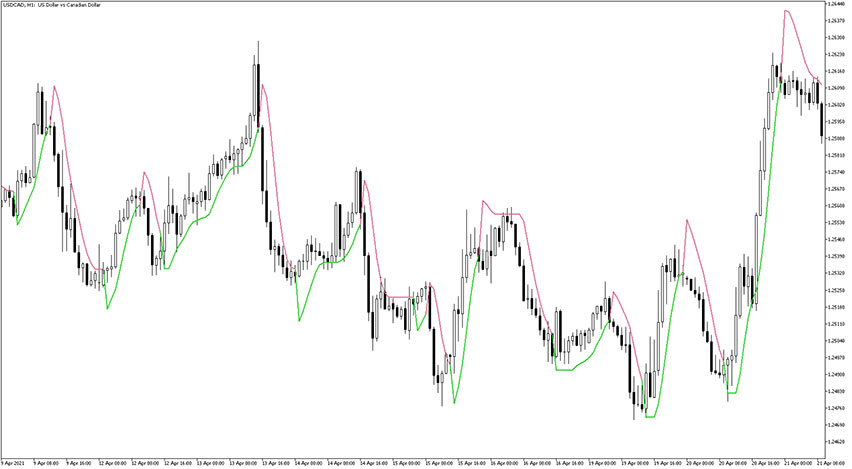
Introduction to the Super Trend Hull Indicator The Super Trend Hull indicator is, as the name suggests, a custom forex indicator that compounds Super Trend and Hull indicators. That gauge incorporates the ATR within its algorithm formula as a means of modifying its signal mode. The signals provided by the Super Trend Hull indicator are…
RSI Divergence Indicator
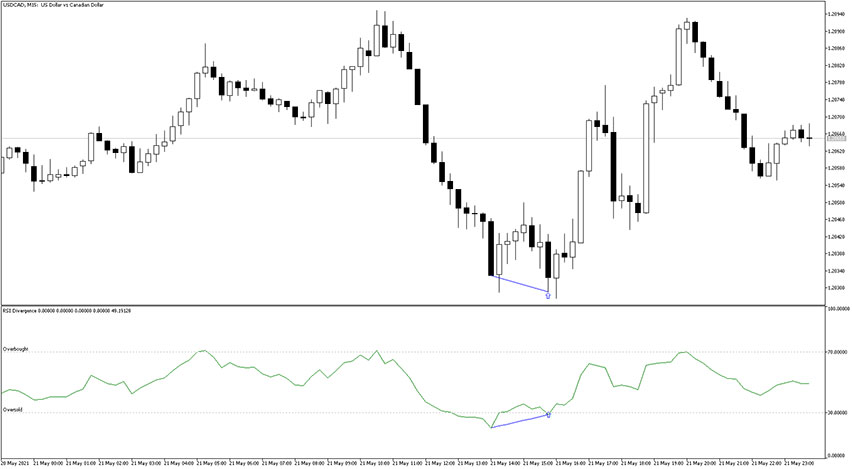
Introduction to the RSI Divergence Indicator The name of the RSI Divergence indicator seeks for Relative Strenght Index divergences and displays them both within indicators window and on the activity chart in conjunction with buy/sell arrows. The indicator is displayed in a separate window placed just below the main trading chart. It fits all kinds…