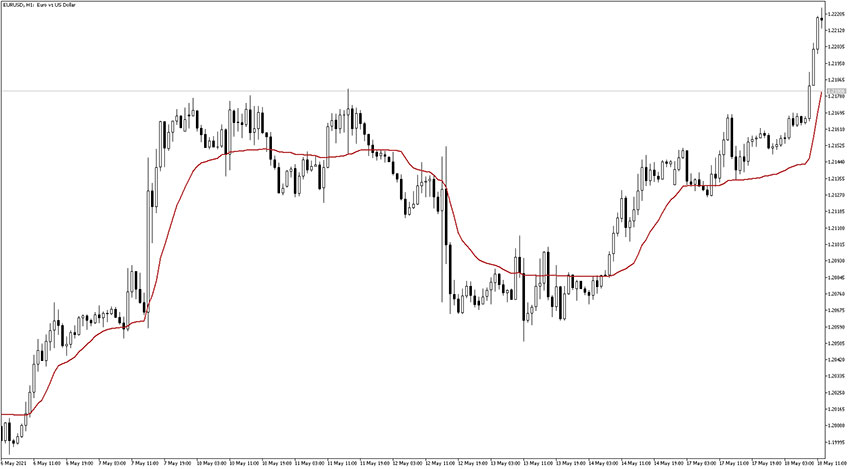
Introduction to the KAMA Indicator The name of the KAMA indicator stands for the Kaufman Adaptive Moving Average. The author of that indicator Perry J. Kaufman, first introduced that concept in his book titled Smarter Trading: Improving Performance in Changing Markets in the year 1995. This is a variation of the adaptive moving average, which…
Category: Forex MT5 Indicators
Price Volume Trend Indicator
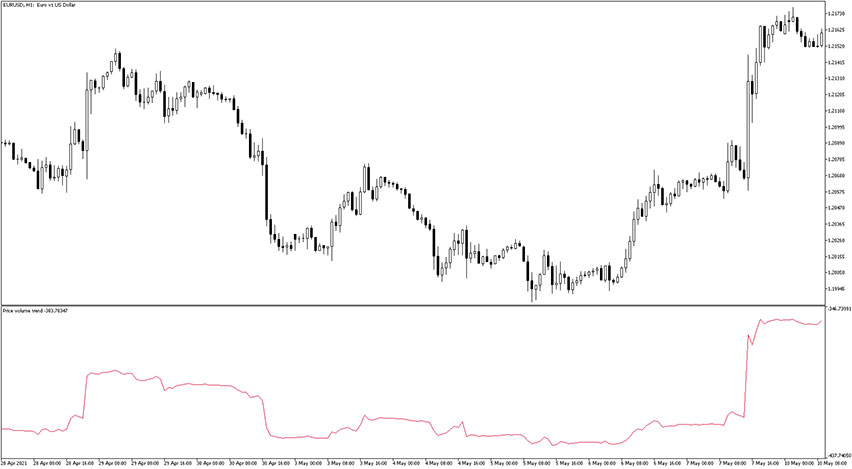
Introduction to the Price Volume Trend Indicator The Price Volume Trend indicator reveals price trend as well as volume. It works in a similar manner to the standard On Balance Volume (OBV) indicator. The amount of the volume that needs to be added to the most recent value is determined by the value of price…
Candle Ratio Indicator
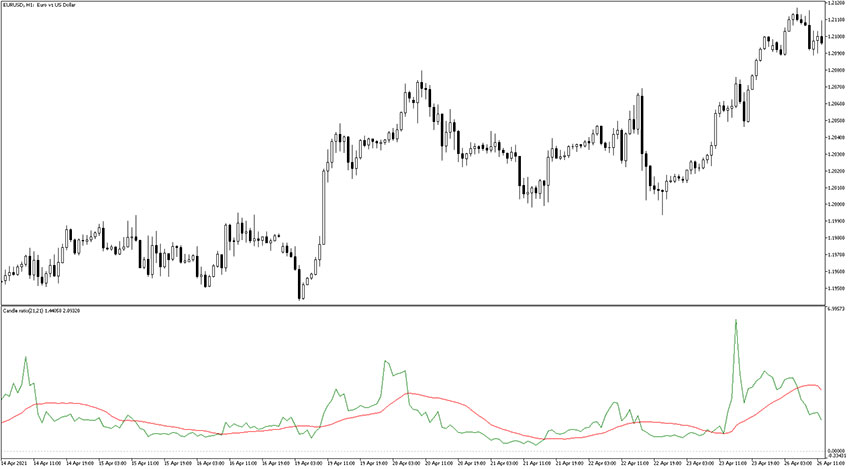
Introduction to the Candle Ratio Indicator The Candle Ratio indicator measures the ratio that exists between the bullish and bearish candlesticks over the defined period of time. It consists of two lines which are colorized red (smoother line) and green (sensitive line). The indicator is displayed in a separate window placed just below the main…
Point of Balance (POB) Indicator
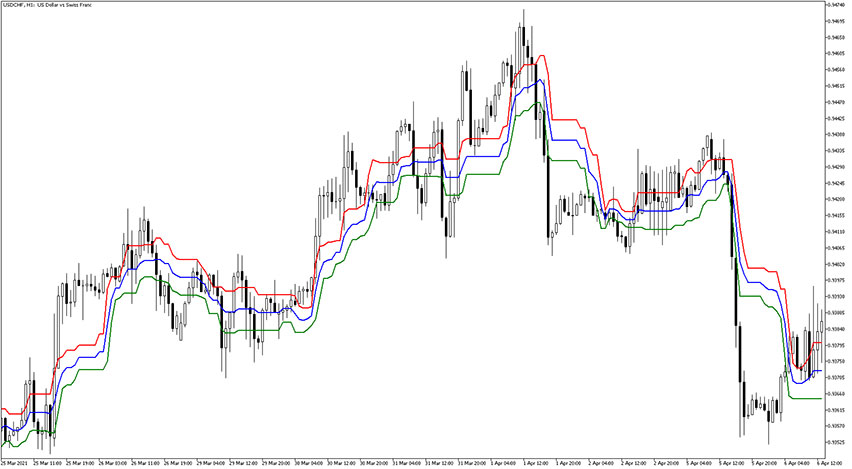
Introduction to the Point of Balance Indicator The Point of Balance (POB) indicator lays a triple line channel that serves as the current trend revealer. The price and candlestick move above/below that channel. It consists of three lines: the red and green lines are aligned to the upper outer and lower outer boundaries of the…
Synthetic VIX Indicator
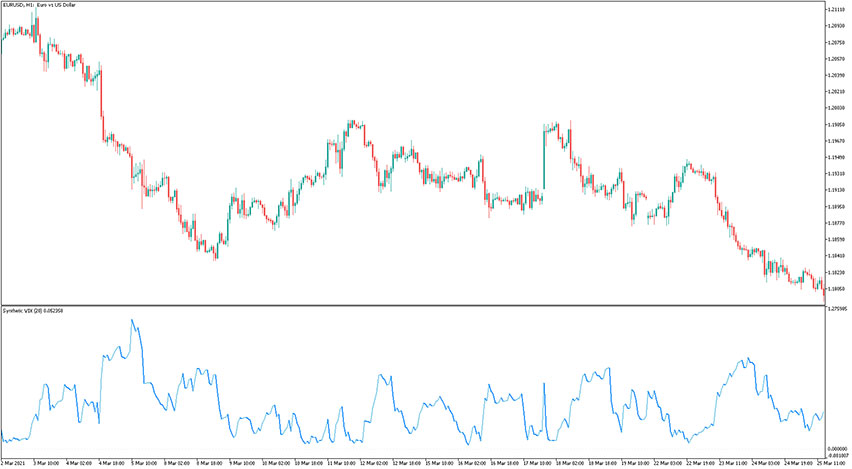
Introduction to the Synthetic VIX Indicator The Synthetic VIX indicator is a forex indicator that measures the increase or decrease of volatility. The indicator is based on Larry Williams’ TASC articles “Fix the VIX”: Bernard Baruch described the market with these words: “market fluctuates”. The indicator is displayed in a separate window placed just below…
Coppock Indicator
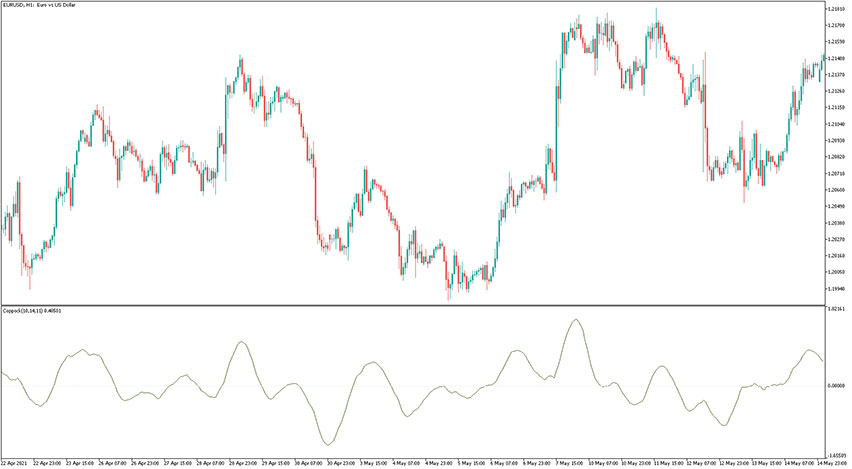
Introduction to the Coppock Indicator The Coppock indicator is a custom forex indicator that works like an oscillator recognizing market trends. That indicator was first introduced by Edwin Sedgwick Coppock in 1962. He published the formula for calculating the Coppock indicator in the Barron’s Magazine. The formula used in calculating the Coppock does not take…
Mass Index Indicator

Introduction to the Mass Index Indicator The Mass Index (MI) indicator is used as an accurate trading tool to pinpoint trend reversals as they occur on the chart. That forex indicator is built around the changes between the highest and the lowest prices. The indicator is displayed in a separate window placed just below the…
RSI Slope Divergence Indicator MTF
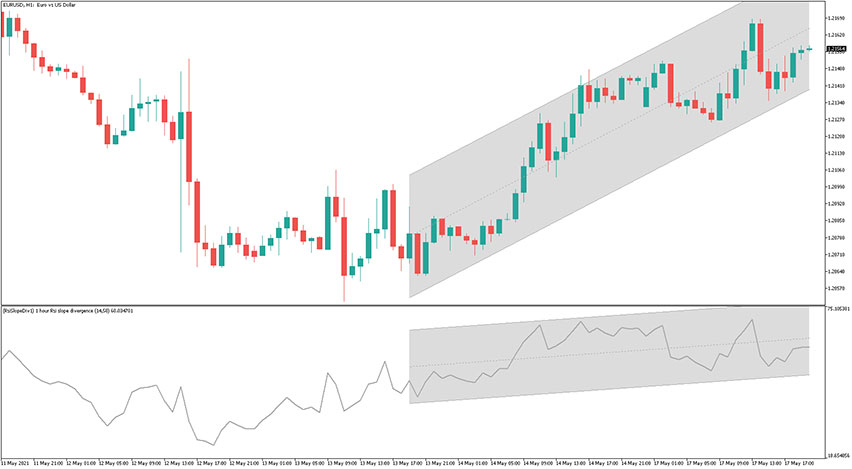
Introduction to the RSI Slope Divergence Indicator MTF The RSI Slope Divergence indicator MTF plots two linear regression channels: directly on the price and on the Relative Strength Index (RSI). It is a multi-timeframe indicator. The general usage of that gauge is divergences detection, but also correction or retracement even before it occurs. The indicator…
Price Cycle Indicator
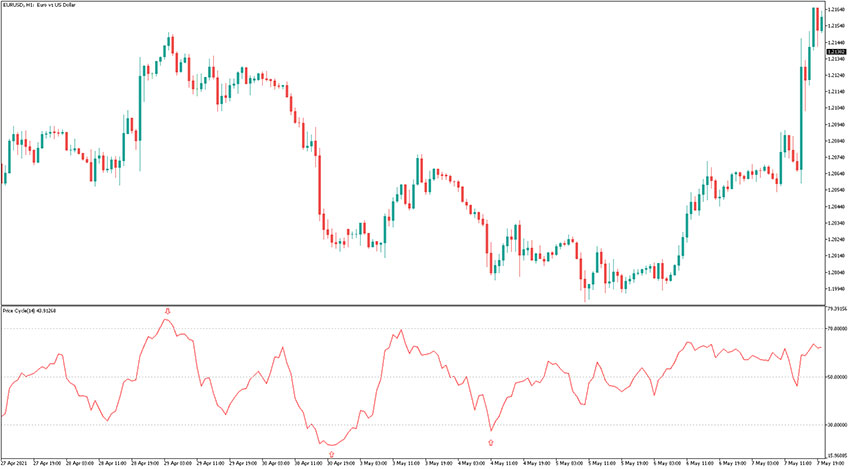
Introduction to the Price Cycle Indicator The Price Cycle (PC) indicator is a custom forex oscillator that is used by traders to reveal market cycles in the short and long term periods. A market cycle is defined by series of repeated patterns and that gauge does pretty well in spotting such patterns. The indicator is…
Glitch Index Indicator
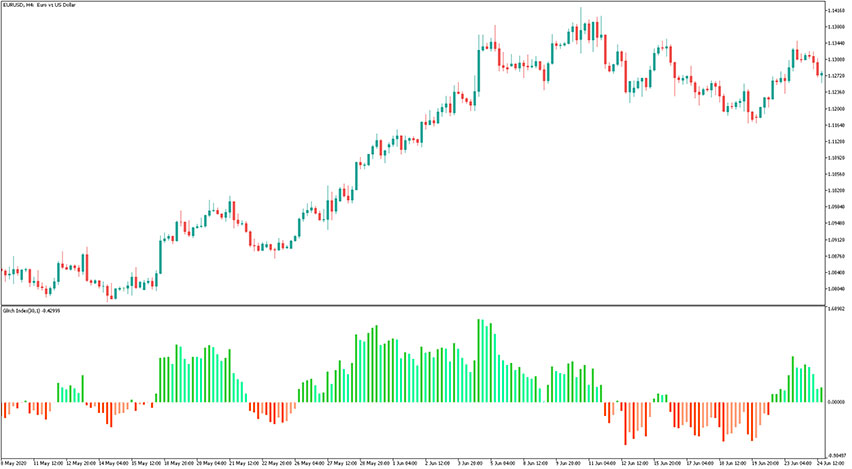
Introduction to the Glitch Index Indicator The Glitch Index indicator is a custom forex histogram indicator that shows the index of the price deviation from its average value. That gauge was first introduced in the February edition of Active Trader Magazine in the year 2004. Since then, it has continued to gain popularity and support…